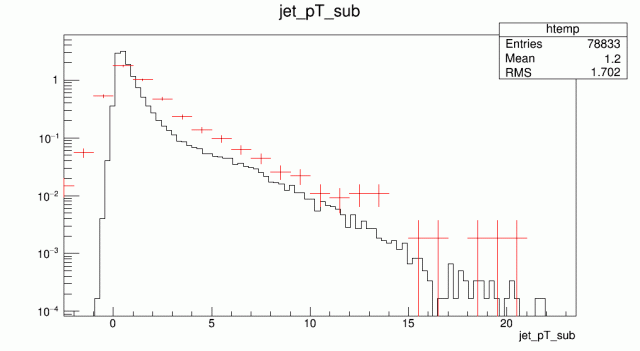
Reconstructed Jet pT Spectrum, Pythia vs. Peripheral Data
Updated on Thu, 2016-02-25 15:13. Originally created by dmawxc on 2016-02-19 19:01.


The red points are 60-70% centrality data. The black distribution is from a Pythia simulation of pp-collisions at sqrt(sNN) = 200 GeV, and is normalized by number of triggers and by bin width. Both cases were reconstructed using the FastJet3 implementation of the anti-kT algorithm with R=0.3, and the resultant pT distributions were corrected via 'pTcorr = pTrecon. - rho * Ajet', where 'rho' is the mean energy density and 'Ajet' is the area of the jet in question.
