Charged Particle Spectra for 3.85 AGeV
The following spectra plots have an arbitrary normalization. Keep in mind the efficiencies are assumed to be 1, there are additional acceptance issues that are unaccounted for and still some bugs in the code to produce these spectra. It's quite raw, but gives a good idea about what we can see.

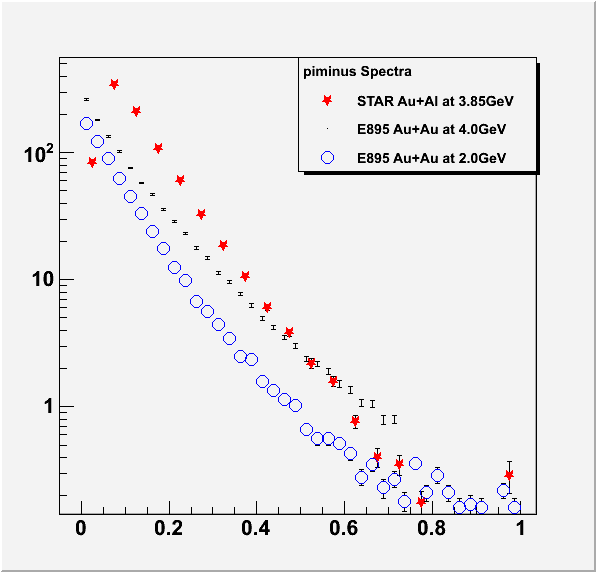
STAR Pi-minus spectra (red stars) compared against E895 data at 2GeV (open circles, blue) and 4GeV (black lines) beam kinetic energy.
Axes are (1/2*pi)(1/mt)(d2N/dmtdy) y-axis versus (mt-m0) x-axis.

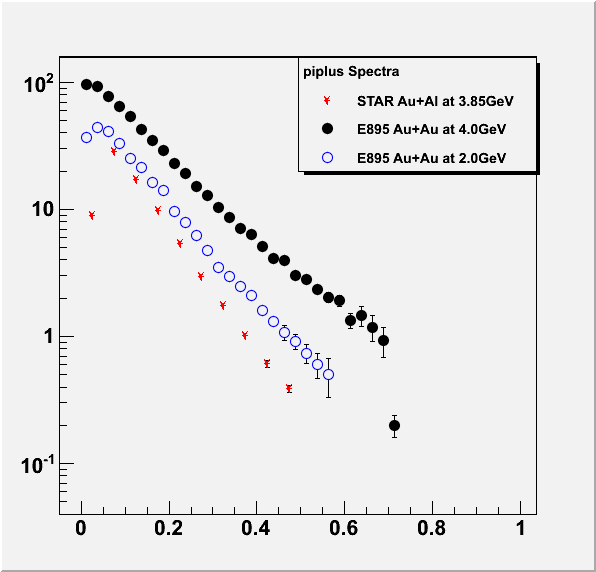
STAR Pi-plus spectra (red stars) compared against E895 data at 2GeV (open circles, blue) and 4GeV (black closed circles) beam kinetic energy.
Axes are (1/2*pi)(1/mt)(d2N/dmtdy) y-axis versus (mt-m0) x-axis.

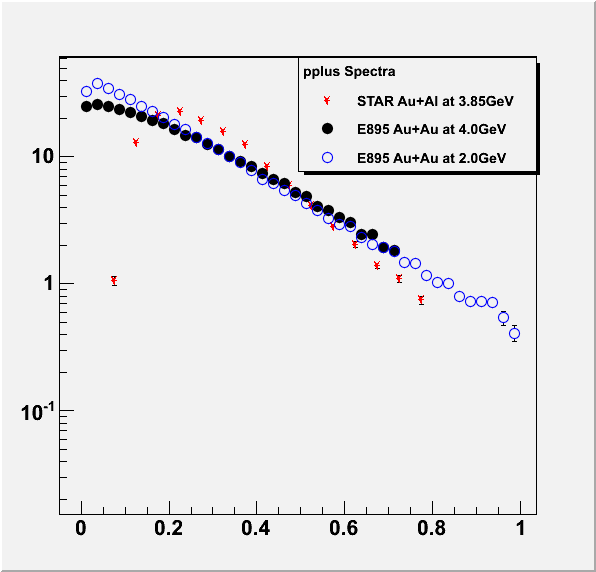
STAR proton spectra (red stars) compared against E895 data at 2GeV (open circles, blue) and 4GeV (black closed circles) beam kinetic energy.
Axes are (1/2*pi)(1/mt)(d2N/dmtdy) y-axis versus (mt-m0) x-axis.

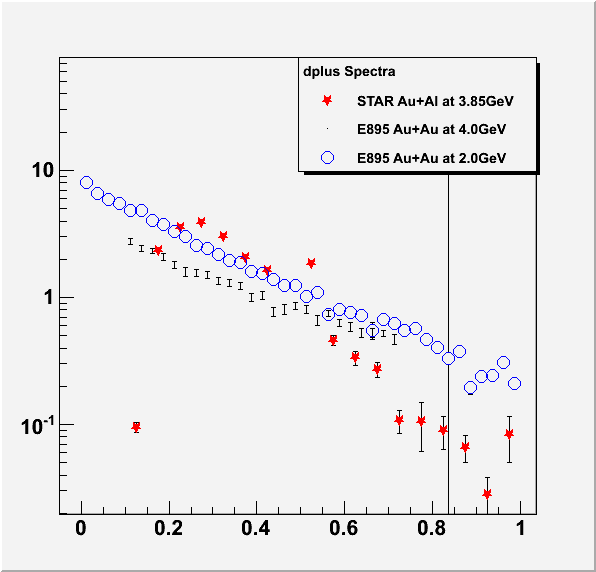
STAR deuteron spectra (red stars) compared against E895 data at 2GeV (open circles, blue) and 4GeV (black lines) beam kinetic energy.
Axes are (1/2*pi)(1/mt)(d2N/dmtdy) y-axis versus (mt-m0) x-axis.
You can see some problem with one of the error bars and one data point quite off the general trend. Looking at the histograms I currently have, it seems that entries that should have been in the 425MeV mt bin were shifted into the 475MeV bin for the STAR data and it also appears there was a conversion error in getting the 2GeV data errors.
The general trend you can see is that STAR is consistently softer than the 4GeV E895 results.
- sgbrovko's blog
- Login or register to post comments
