- sdhamija's home page
- Posts
- 2013
- 2012
- December (1)
- November (4)
- October (3)
- September (4)
- August (3)
- July (1)
- June (4)
- May (3)
- April (2)
- March (2)
- February (9)
- January (3)
- 2011
- December (1)
- November (6)
- October (4)
- September (4)
- August (3)
- July (8)
- June (6)
- May (5)
- April (1)
- March (2)
- February (6)
- January (7)
- 2010
- My blog
- Post new blog entry
- All blogs
First look at BDT classifier : Data vs MC
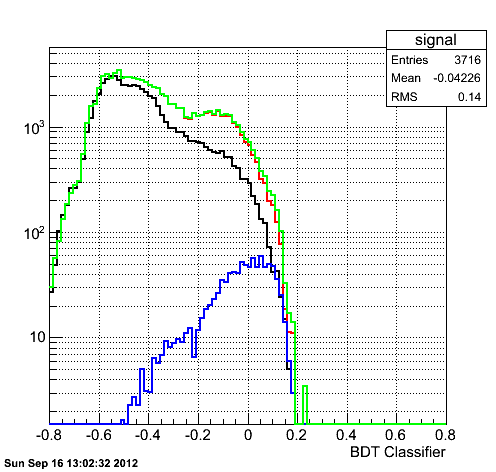
First look at BDT classifier
Note: Please ignore the histogram name. For some reason I am not able to get rid of it in my macro.
Here black curve corresponds to the data . Red is qcd background and blue one is prompt photon.
.png)
How did I generate this curve?
(i) This plot is integrated over all pT bins and all preshower conditions.
(ii) For the SMD, I have just included the ratio of five strips to twenty five strips in the two planes.
(iii) I have scaled the prompt photon and qcd background sample to 3.146 pb-1 (data luminosity).
Following 15 variables were used to model the response:
nCh, nBtow, nEtow, ptBalance, R2x1jet7, R2x1c3x3, R2x1c2x2, R2x2c3x3, nU, nV, fiveStripU/twentyfiveStripU, fiveStripV/twentyfiveStripV, ePre1, ePre2, ePost
BDT setup parameters :
NTrees=120, MaxDepth=1, AdaBoostBeta=0.70, SeparationType = GiniIndex, nCuts=50, PruneMethod=NoPruning
After running BDT with the above setup, I had shown the following plots in one of our local meetings:
.png)
.png)
.png)
I didn't show BDT response (test sample) plot earlier but as you can see , QCD component is bi-modal. I have no clue so far but I remember from my earlier plots that we never had a good agreement for the preshower1 and preshower2 layers after 40 and 80 MeV. So, the next step would be imposing these cuts and looking at the response. One can also bin the data in different pT bins.
After adding signal and background (green curve overlayed on the first BDT plot), my first BDT plot looks like this:
Groups:
- sdhamija's blog
- Login or register to post comments