- sdhamija's home page
- Posts
- 2013
- 2012
- December (1)
- November (4)
- October (3)
- September (4)
- August (3)
- July (1)
- June (4)
- May (3)
- April (2)
- March (2)
- February (9)
- January (3)
- 2011
- December (1)
- November (6)
- October (4)
- September (4)
- August (3)
- July (8)
- June (6)
- May (5)
- April (1)
- March (2)
- February (6)
- January (7)
- 2010
- My blog
- Post new blog entry
- All blogs
Data/MC Comparison Fudge Factor and BDT Issues
Data/MC Comparison Fudge Factor and BDT Issues
(I) Preselection Cuts
(a) Dijets from the jet trees with an associated gamma to one of the jets from the gamma trees
(b) z vertex cut -100cm<z<100cm
(c) Neutral fraction of jet matched to photon > 0.9
(d) Photon and jet are opposite in φ [cos(φΥ – φjet)] < -0.8
(e) PT of photon > 7GeV
(f) pT of away side jet > 5GeV
(g) Detector eta of the away side jet : ІηjetІ < 0.8
(h) Detector eta of photon 1.08<η<2.0
(i) Number of hits in each SMD plane (u,v) >3
(II) Monte Carlo Samples
QCD Background scaled to 3.146 pb-1
(a) First partonic bin weight (4-6 GeV) : 3.727
(b) Second partonic bin weight (6-9 GeV) : 3.756
(c) Third partonic bin weight (9-15 GeV) : 3.453
(d) Fourth partonic bin weight (15-35 GeV) : 2.886
Prompt photon sample scaled to 3.146 pb-1
(a) First partonic bin weight (2-3 GeV) : 0.292
(b) Second partonic bin weight (3-4 GeV) : 0.3096
(c) Third partonic bin weight (4-6 GeV) : 0.2881
(d) Fourth partonic bin weight (6-9 GeV) : 0.3175
(e) Fifth partonic bin weight (9-15 GeV) : 0.3349
(d) Fourth partonic bin weight (15-35 GeV) : 0.03013
pT Spectrum of photons after applying a fudge factor of 1.397
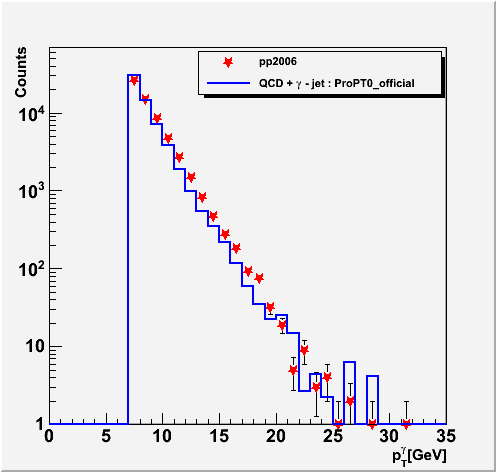
Total number of counts in the data = 60310
Total number of counts in the MC = 84242
MC/Data = 1.397
BDT Issues :
These plots are integrated over all pT bins and all preshower conditions.
Following 15 variables were used to model the response:
nCh, nBtow, nEtow, ptBalance, R2x1jet7, R2x1c3x3, R2x1c2x2, R2x2c3x3, nU, nV, fiveStripU/twentyfiveStripU, fiveStripV/twentyfiveStripV, ePre1, ePre2, ePost
BDT setup parameters :
NTrees=120, MaxDepth=1, AdaBoostBeta=0.70, SeparationType = GiniIndex, nCuts=50, PruneMethod=NoPruning
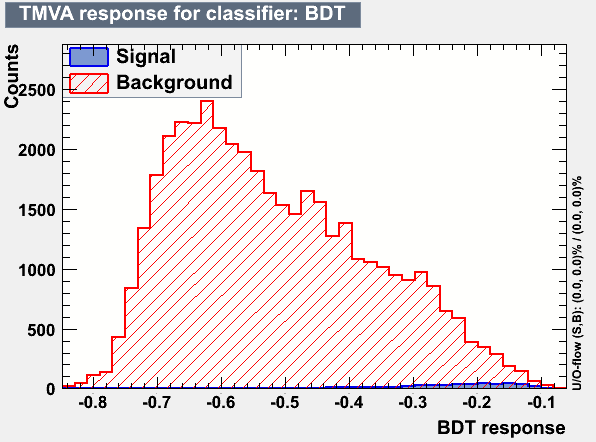
BDT was booked with the following options:
factory->PrepareTrainingAndTestTree( mycuts, mycutb,"SplitMode=Random:NormMode=None:!V" );
Please see the attached BDT_output.txt file to make sure that no weight renormalisation is applied!
As you see in this file, we start with 965 signal events and 83273 background events and split the whole sample into test and training
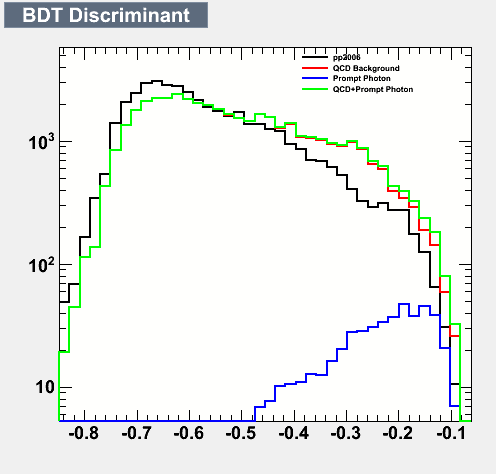
samples randomly. So we have a total of (486+41632)42118 events for the test sample. After running the BDT we get the follwoing
BDT discriminant plots for signal and background events.
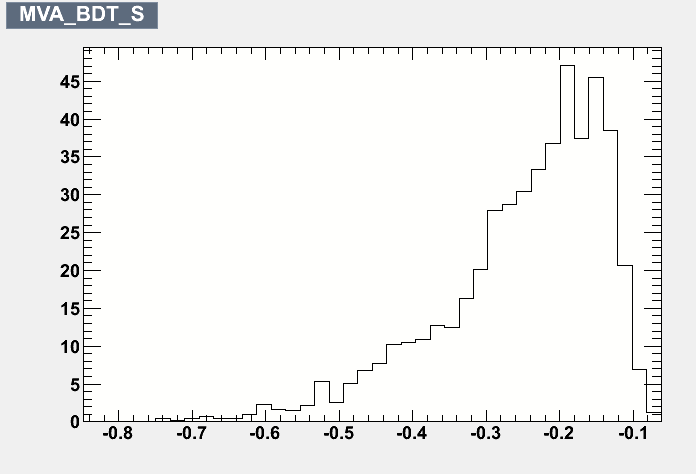
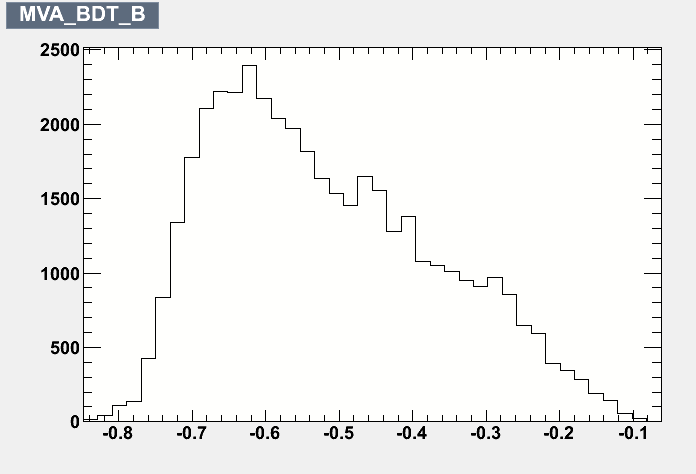
Integral(MVA_BDT_S) = 486 Integral(MVA_BDT_B) = 42118
Few other BDT plots from MC
.png)
.png)
.png)
Then I run the weight file generated by this BDT on my data sample and get the following discriminant plot.
Groups:
- sdhamija's blog
- Login or register to post comments