- sdhamija's home page
- Posts
- 2013
- 2012
- December (1)
- November (4)
- October (3)
- September (4)
- August (3)
- July (1)
- June (4)
- May (3)
- April (2)
- March (2)
- February (9)
- January (3)
- 2011
- December (1)
- November (6)
- October (4)
- September (4)
- August (3)
- July (8)
- June (6)
- May (5)
- April (1)
- March (2)
- February (6)
- January (7)
- 2010
- My blog
- Post new blog entry
- All blogs
Boosted Decision Trees : New Plots
BDT was evaluated with the following setup:
NTrees=100:nEventsMin=20:MaxDepth=1:BoostType:AdaBoost:AdaBoostBeta=0.3:SeparationType:GiniIndex:nCuts=20
:PruneMethod=NoPruning
(a) Overtraining Plot
.png)
(b) Background rejection vs signal efficiency plot
.png)
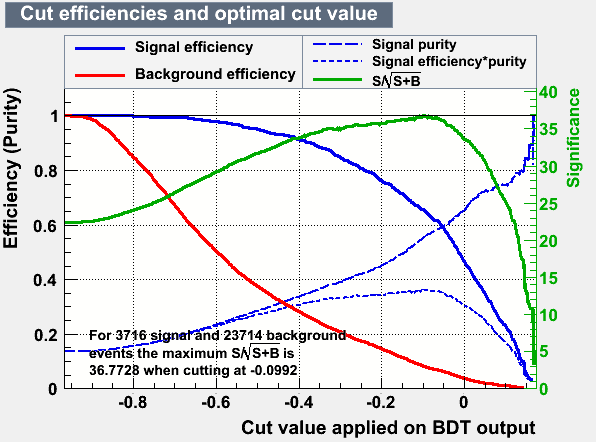
(c) Efficiency Plot
(d) BDT Output
.png)
| Classifier | #signal,#background | Optimal-cut | S/sqrt(S+B) | Nsig | Nbkg | EffSig | EffBkg |
| BDT | 3716,23714 | -0.0992 | 36.77 | 2436 | 1953 | 0.656 | 0.082 |
Note : Please see the attached files for input variables and correlation matrix plots
Groups:
- sdhamija's blog
- Login or register to post comments