- sdhamija's home page
- Posts
- 2013
- 2012
- December (1)
- November (4)
- October (3)
- September (4)
- August (3)
- July (1)
- June (4)
- May (3)
- April (2)
- March (2)
- February (9)
- January (3)
- 2011
- December (1)
- November (6)
- October (4)
- September (4)
- August (3)
- July (8)
- June (6)
- May (5)
- April (1)
- March (2)
- February (6)
- January (7)
- 2010
- My blog
- Post new blog entry
- All blogs
Boosted Decision Trees : Minimizing the extent of overtraining
Boosted Decision Trees : Minimizing the extent of overtraining
Pre-selection cuts :
It is possible to supply TMVA with mandatory cuts which it must perform, before the data even reaches a decision tree. These filter out events which are extremely unlikely candidates. Such cuts are known as pre-selection cuts. The following preselections were used :
(1) z vertex cut : -100cm < z < 100cm
(2) Photon and jet are back to back
(3) Detector eta of the away side jet < 0.8
(4) pT of photon > 7GeV
(5) pT of away side jet > 5GeV
Overtraining :
Overtraining occurs when the BDT becomes sensitive to statistical fluctuations in the training sample. This can be caused by highly correlated variables and/or too many degrees of freedom in the BDT. Overtraining is quantified using a Kolmogorov-Smirnov (KS) test. The result is the likelihood that the distribution obtained from the test sample could have been obtained from the training sample, which for an overtrained BDT is unlikely. Overtraining may be reduced by altering the number of trees, the pruning method, the tree depth, the number of nodes, the number of cuts and the minimum number of events per node etc. Table 1 shows the different parameter setups for which trees were trained and tested, as well as the resultant figure of merit, signal efficiency and background efficiency for each setup.
.png)
For the following plots, BDT was evaluated with the parameter setup (i):
NTrees=1000:nEventsMin=200:MaxDepth=3:BoostType:AdaBoost:AdaBoostBeta=0.5:SeparationType:GiniIndex:nCuts=20
:PruneMethod=NoPruning
Figure 1 : Input Variables
.png)
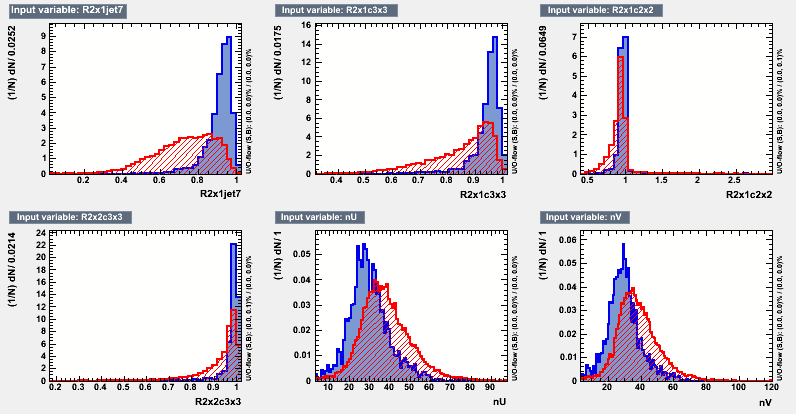
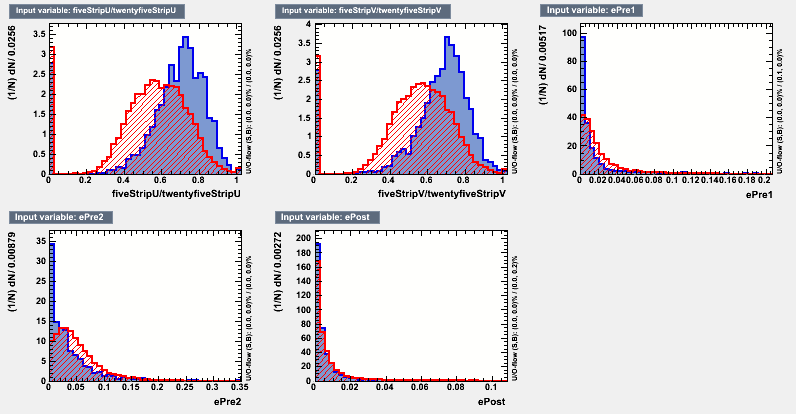
Figure 2: Correlation Matrix for signal events
.png)
Figure 3: Correlation Matrix for background events
.png)
Figure 4: Overtraining plot
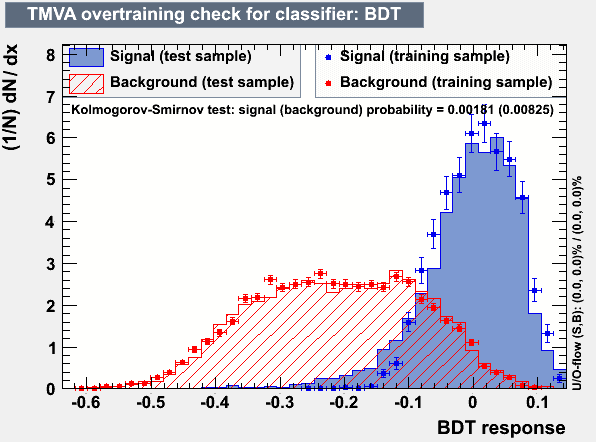
Figure 5: ROC Curve
.png)
Figure 6: Output distribution
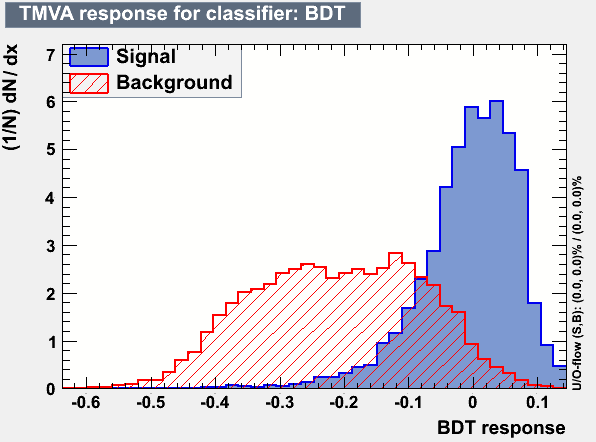
Figure 7: Efficiencies plot

Groups:
- sdhamija's blog
- Login or register to post comments