online plots
dear all ppFuns,
please have a look at online plots proposed for
next run. Any suggestions concerning attached plots
and new ones are welcome. Please keep in mind that
number of plots, their size ( number of bins ) and
contents ( cpu time needed to retrieve specific
information from raw data stream ) are subject for restriction
due to fraction of band width assigned. Also one needs to know
that only ~1% of events taken during a run enter online plots,
so there no much sense to ask for plots which require large
statics to be conclusive.
According to what Kin passed to me, moderate numbers
of bins ~100 per histo, time ~< 1milisecond/event.
Proposed set of online plots consists of 59 plots, takes
~ 0.4 milisec/event. These plots were obtained from ~1800
events of run 10181086.
Legend:
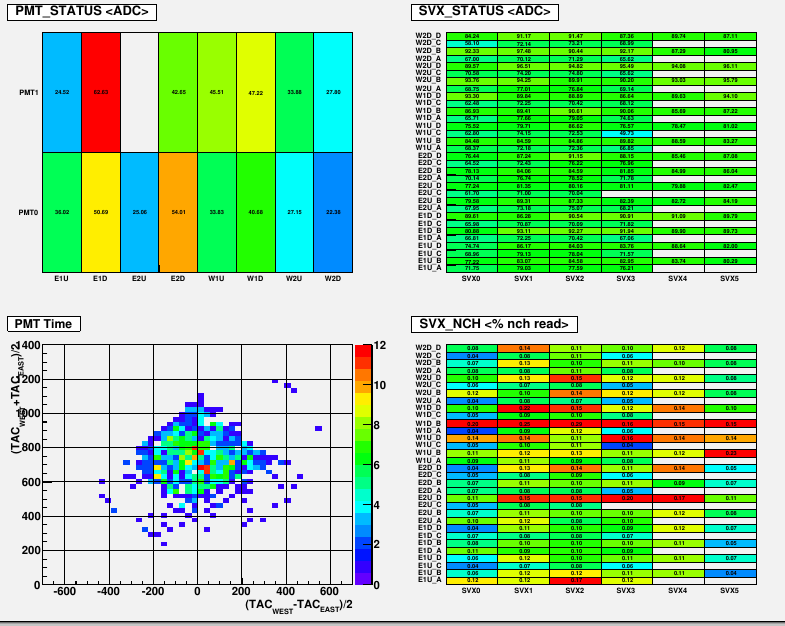
1. page1 - STAR/system/files/userfiles/3477/Monit-p1.png
two plots in top row, show <adc> for PMT's (left top)
and SVXes. White box in the plot mean dead/missing or
reading way below average ( eg. PMT1 of E2U has
very low yield ) component.
- left bottom plot ( proposed by Rafal ) is suppose to show
problem with PMT timing.
- right bottom average number of channels per svx read
in zero-suppression mode.
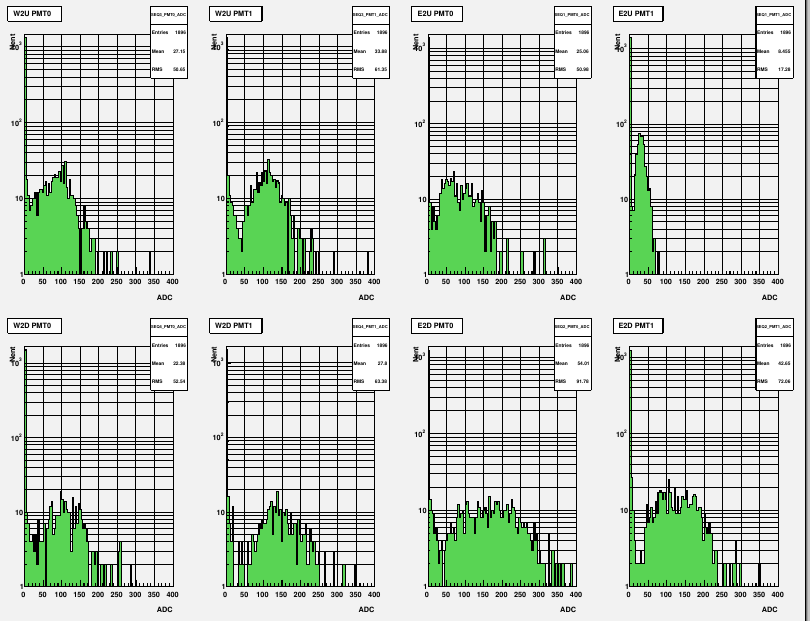
2. page 2 - STAR/system/files/userfiles/3477/Monit-p2.png
ADC plots for all PMTs, did not changed wrt run 2009.
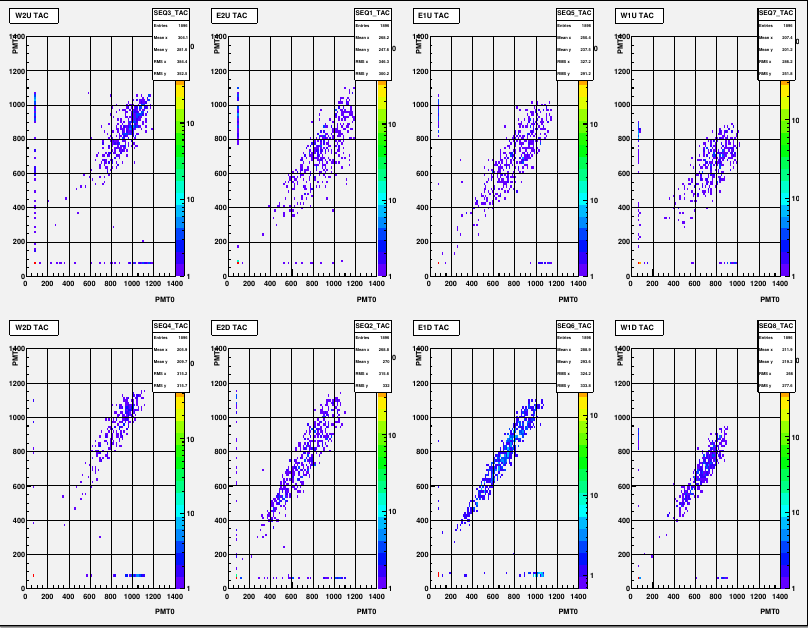
3. page 3 - STAR/system/files/userfiles/3477/Monit-p3.png
2D plots of TAC signal for PMTs
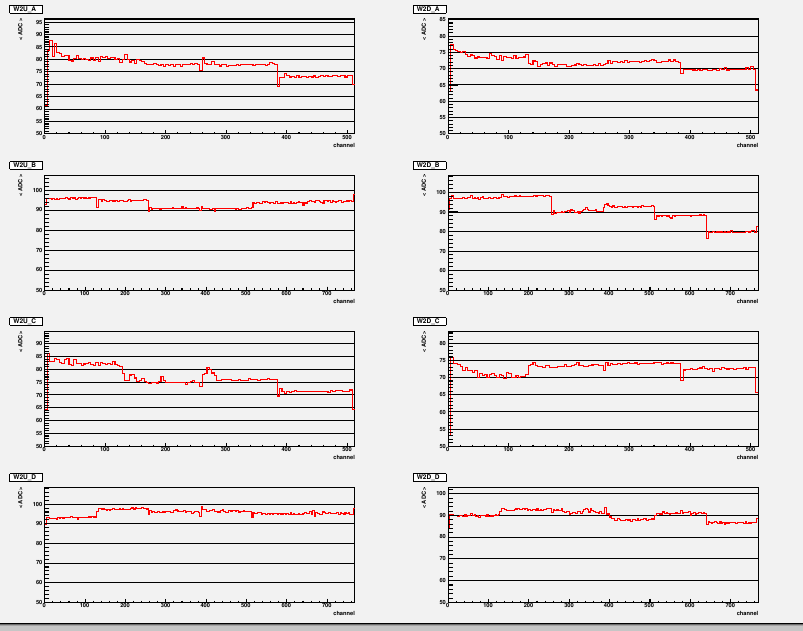
4. page 4 - STAR/system/files/userfiles/3477/Monit-p4.png
average ADC for silicon chains. They show essentially
pedestals
regards bogdan
- pawlik's blog
- Login or register to post comments