- leun's home page
- Posts
- 2013
- 2012
- December (2)
- October (3)
- September (2)
- August (1)
- July (4)
- June (4)
- May (2)
- April (3)
- March (5)
- February (5)
- January (5)
- 2011
- December (3)
- November (3)
- September (5)
- August (2)
- July (2)
- June (3)
- May (4)
- April (4)
- March (2)
- February (4)
- January (2)
- 2010
- December (2)
- November (3)
- October (3)
- September (5)
- August (6)
- July (2)
- June (4)
- May (3)
- April (4)
- March (4)
- February (2)
- January (4)
- 2009
- 2008
- October (1)
- My blog
- Post new blog entry
- All blogs
FMS meeting 20110207
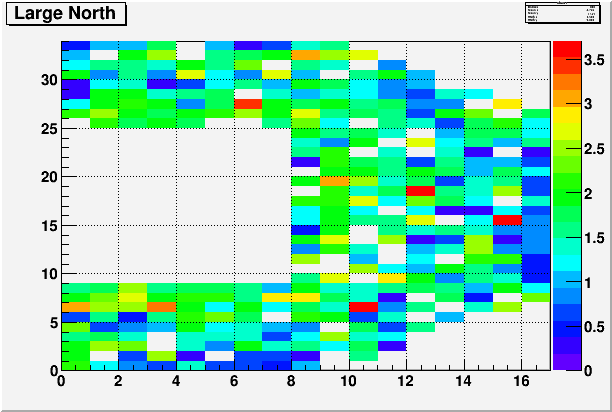
Fig. 1. Run12037012, 1M events, log10(Min Bias counting rate above 10cnt) vs. pseudo-rapidity for Large North
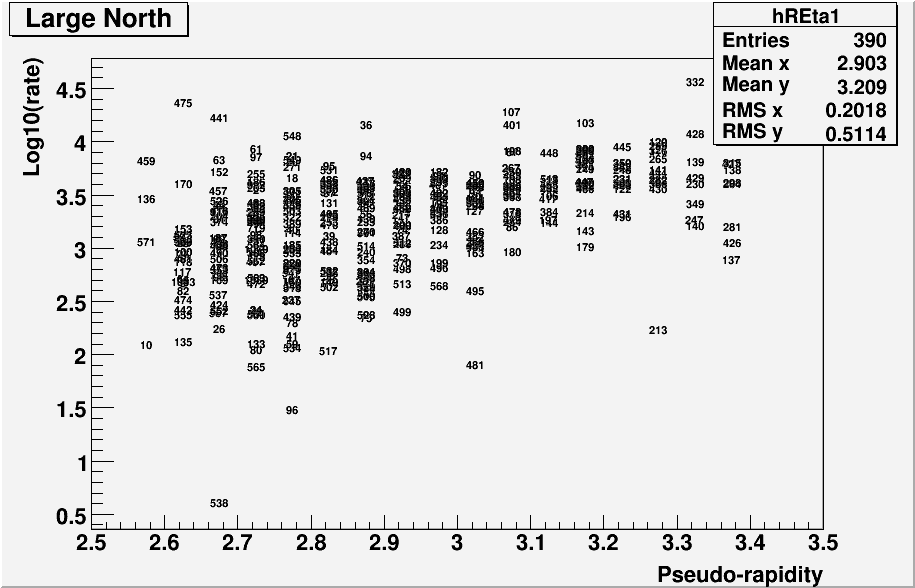
Fig. 2. ADC distribution for channel 96 (counting from 1) for run 12037012
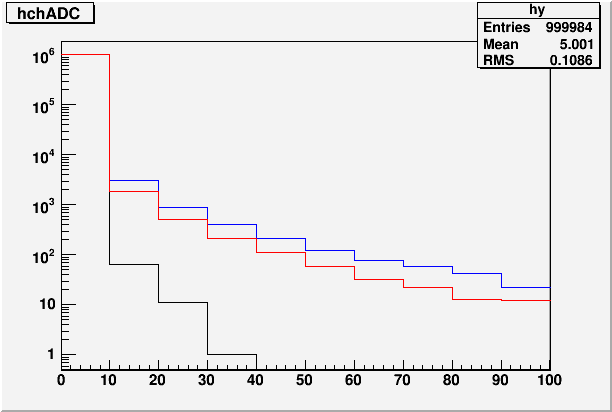
Fig. 3. ADC distribution for channel 96 (counting from 1) for run12038049
.gif)
Fig. 4. Run12038049, 1M events, log10(Min Bias counting rate above 10cnt) vs. pseudo-rapidity for Large North
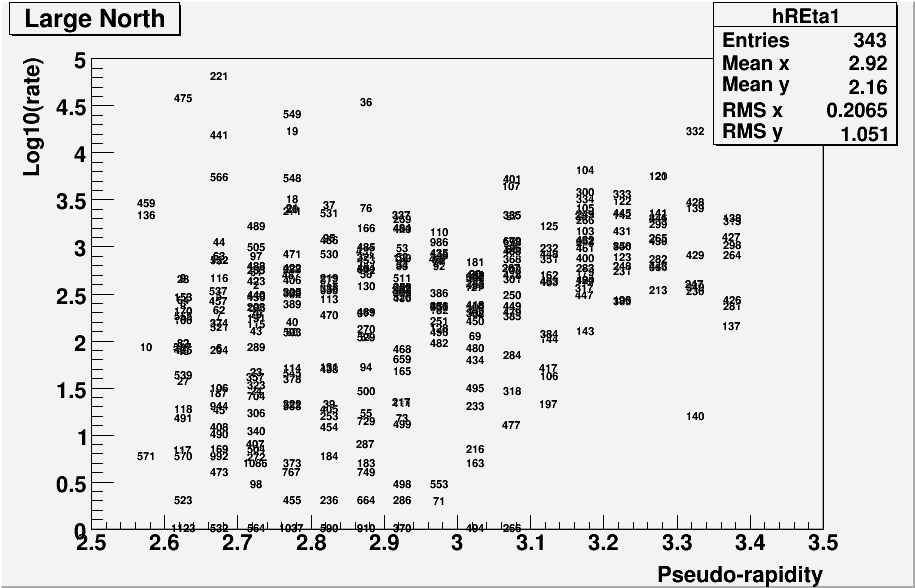
Fig. 5. run12040020, E12>15GeV
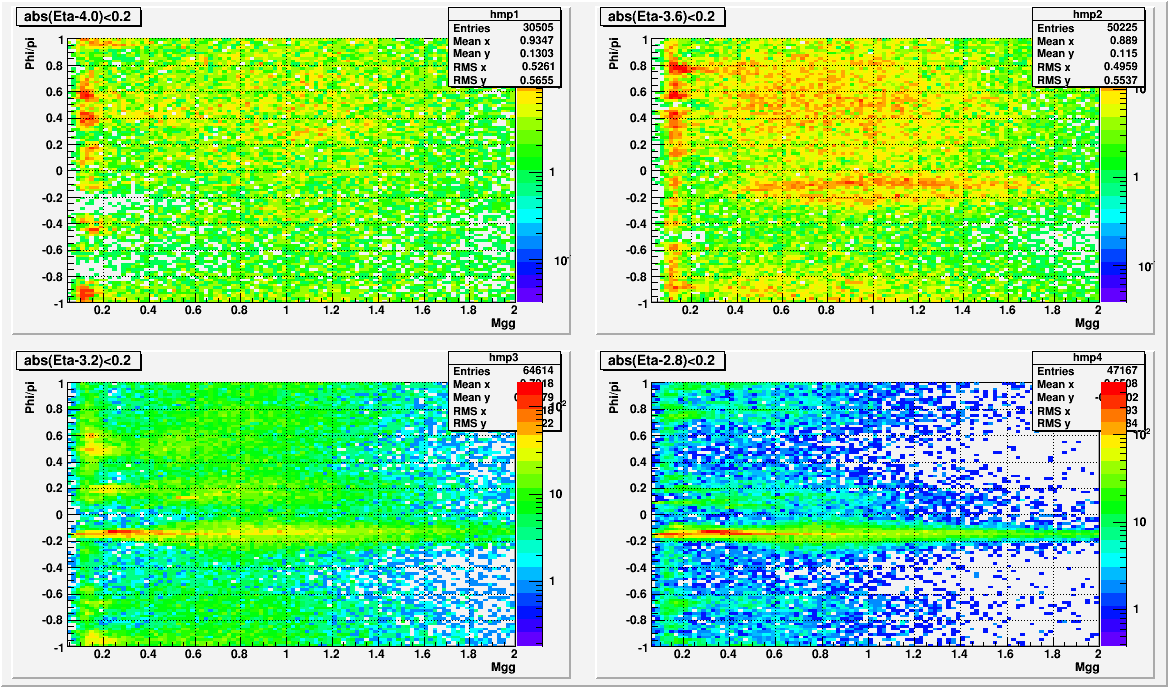
Fig. 5. run12040020, Log10(number of triggers per cell).
Groups:
- leun's blog
- Login or register to post comments
