- leun's home page
- Posts
- 2013
- 2012
- December (2)
- October (3)
- September (2)
- August (1)
- July (4)
- June (4)
- May (2)
- April (3)
- March (5)
- February (5)
- January (5)
- 2011
- December (3)
- November (3)
- September (5)
- August (2)
- July (2)
- June (3)
- May (4)
- April (4)
- March (2)
- February (4)
- January (2)
- 2010
- December (2)
- November (3)
- October (3)
- September (5)
- August (6)
- July (2)
- June (4)
- May (3)
- April (4)
- March (4)
- February (2)
- January (4)
- 2009
- 2008
- October (1)
- My blog
- Post new blog entry
- All blogs
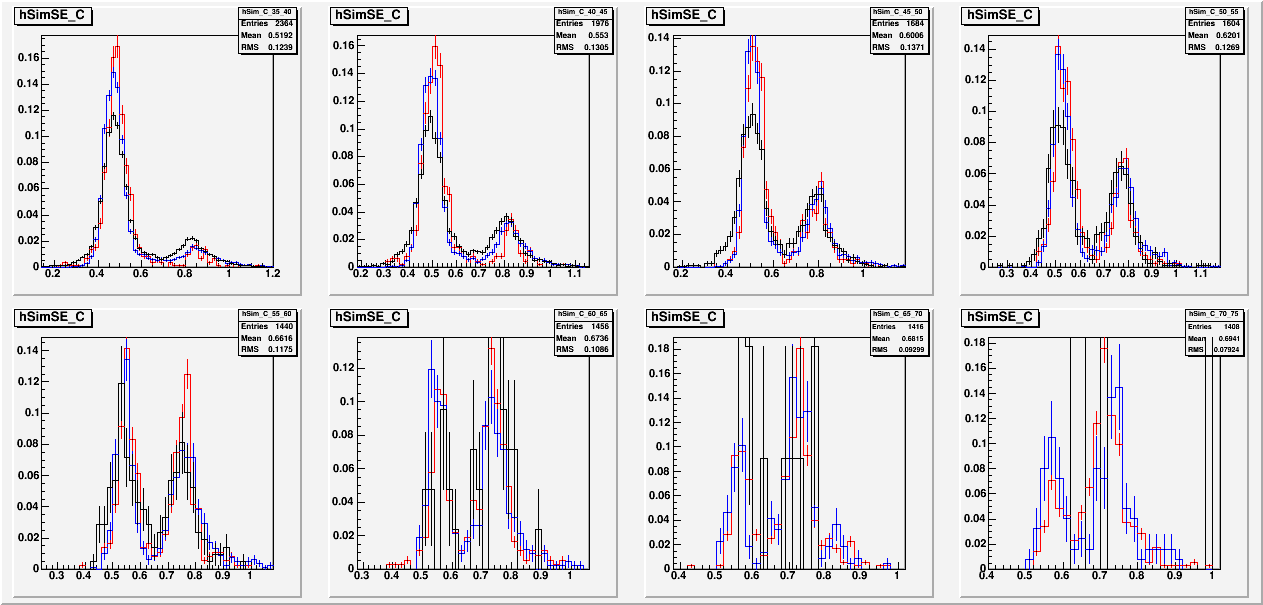
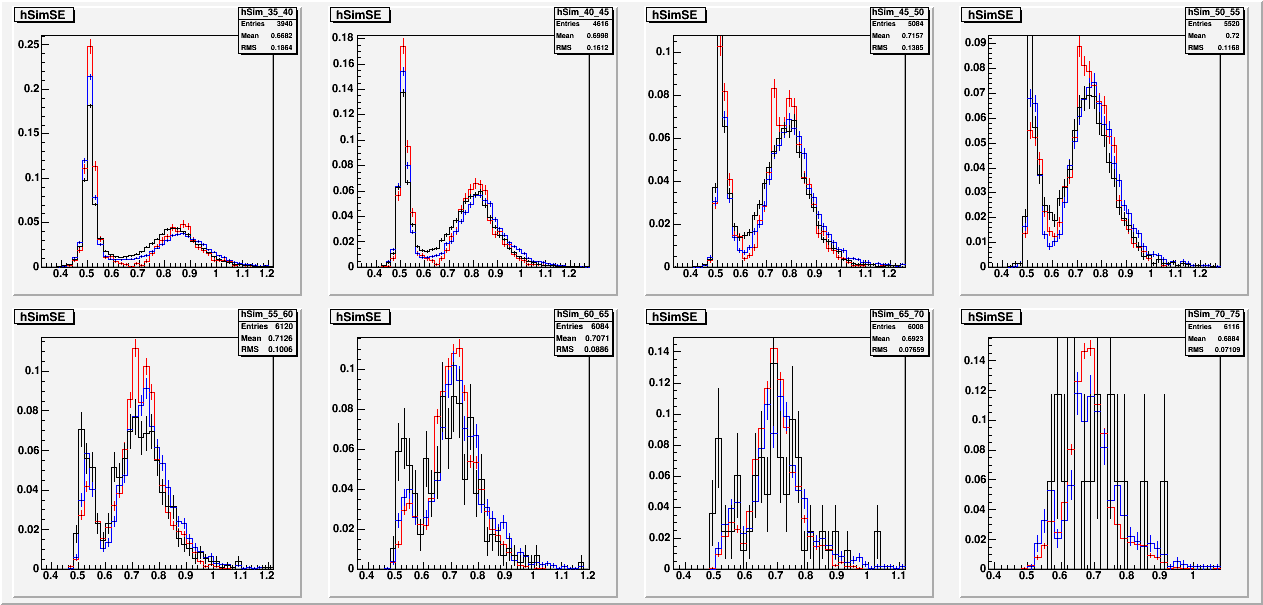
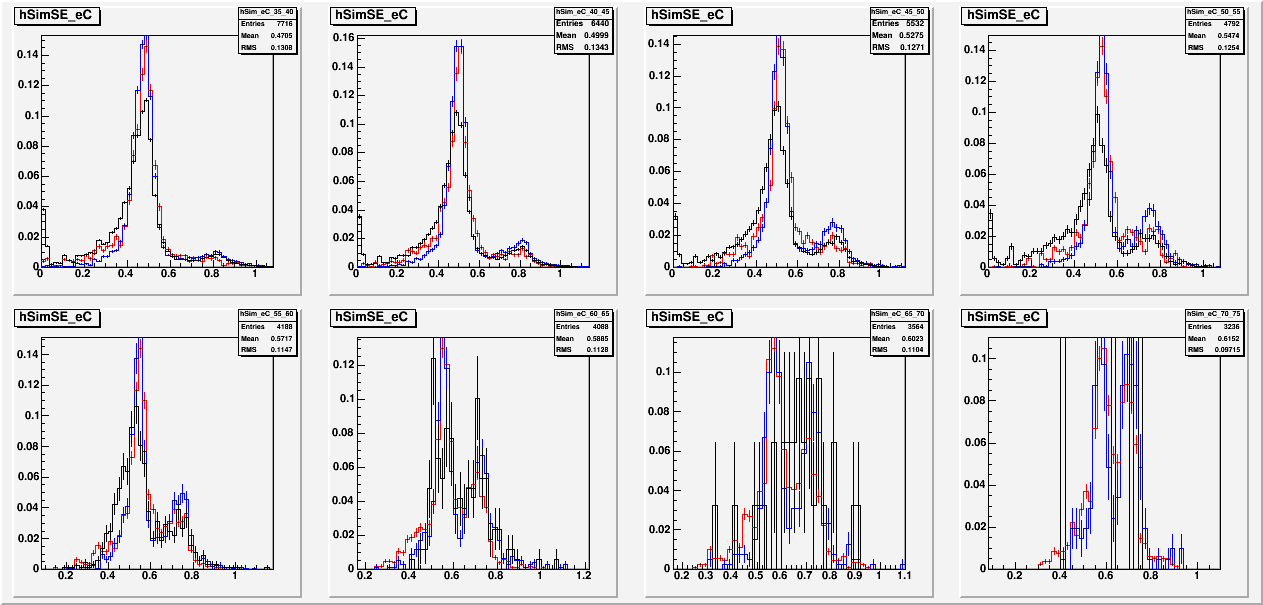
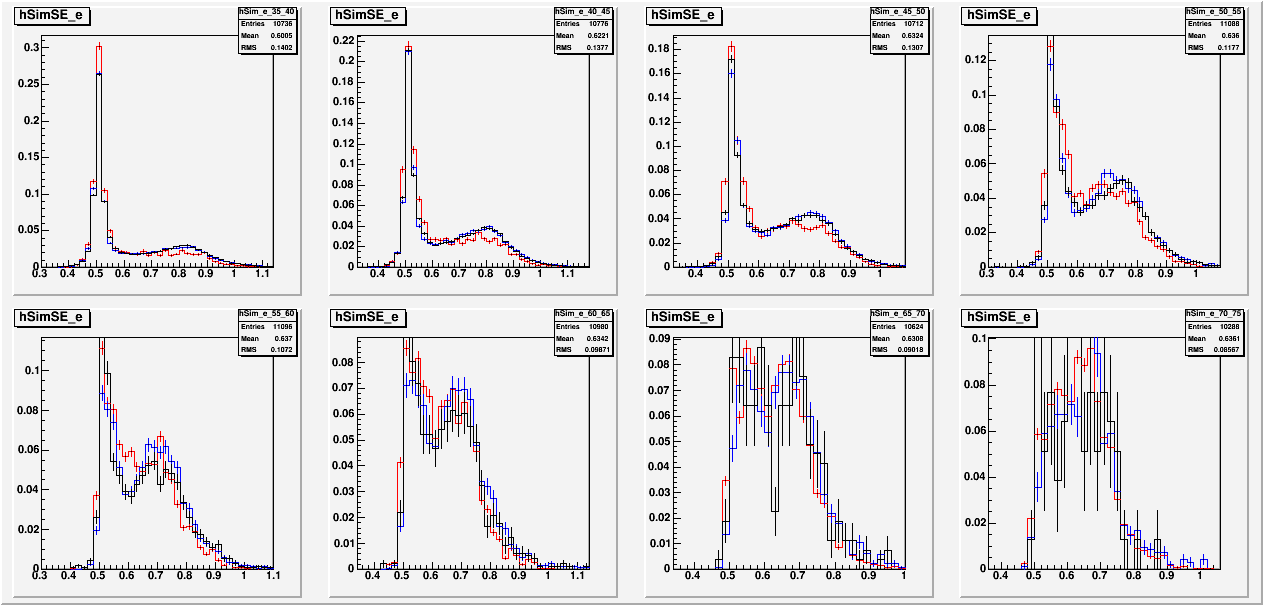
SigmaMax Data-MC comparision-NEW
SigmaMax Data-MC comparision-NEW
All following plots show cluster sigmaMax calculated according to the new scheme. (minimum tower energy=0.5GeV, ln(E) weighting)
BLACK: Data (only set 61)
RED: flat-distribution pi0 toy events + GSTAR, with digitization and 1-count pedestal uncertainty
BLUE: Pythia 6.4 + GSTAR, with digitization and 1-count pedestal uncertainty
Clusters are divided into 4 categories, and for each catgegoy there are 8 plots for 8 energy bins.
1. Inner central

2. Inner non-central

3. Edge central

4. Edge non-central

Groups:
- leun's blog
- Login or register to post comments
