- leun's home page
- Posts
- 2013
- 2012
- December (2)
- October (3)
- September (2)
- August (1)
- July (4)
- June (4)
- May (2)
- April (3)
- March (5)
- February (5)
- January (5)
- 2011
- December (3)
- November (3)
- September (5)
- August (2)
- July (2)
- June (3)
- May (4)
- April (4)
- March (2)
- February (4)
- January (2)
- 2010
- December (2)
- November (3)
- October (3)
- September (5)
- August (6)
- July (2)
- June (4)
- May (3)
- April (4)
- March (4)
- February (2)
- January (4)
- 2009
- 2008
- October (1)
- My blog
- Post new blog entry
- All blogs
Run6 FPD Single Photon GSTAR part2
Link to the first page on uniform spread single photon GSTAR
Here we investigate further the rather abrupt onset of single photon splitting at Esum > ~55GeV.
Total number of reconstructed photons vs. number of reconstructed photons from the first (most energetic) cluster
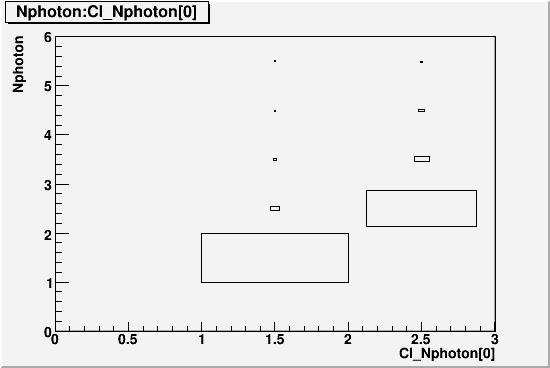
Vast majority of photons come from the first cluster, meaning that the two photon splitting occurs within that cluster as well. While there are sometimes additional clusters, they tend to be very low energy and rarely produce photons. So we focus on the first cluster from here on.
In the reconstruction, a cluster is assigned a category before any fitting is done. Category 0 for an ambiguous cluster, category 1 for a single photon cluster, and category 2 for a two photon cluster. Following is the energy distribution for each category.
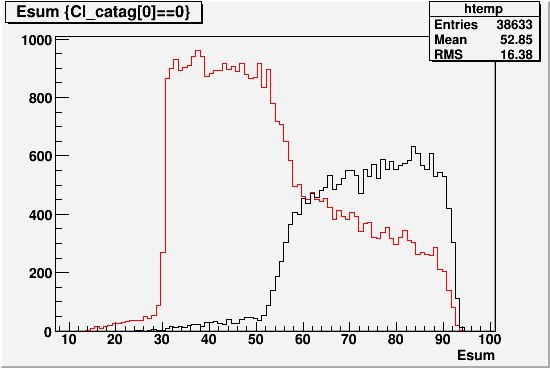
RED is for category 0. BLACK is for category 2. Category 1 cannot be seen because clusters are almost never category 1.
So it is clear that the onset of single photon splitting at ~55GeV has direct correlation with the cluster categorization. All other distributions I've looked at, such as number of towers in a cluster, the size of a cluster, and the sharpness of a cluster all show gradual behavior across the energy range.
So how is the categorization done? Here is the algorithm.
Ec=Energy of the cluster in GeV
SigmaMax=2nd moment of the cluster along an axis that maximizes it in units of cell size.
If ( SigmaMax > (1/2.1 + 7./Ec) ) then Category=0 or 2
else if ( SigmaMax < (1/2.1 + 2./Ec) ) then Category=0 or 1
else Category=0
Essentially we determine whether a cluster is 1-photon-ish or 2-photon-ish by comparing the sigma of the cluster to (0.5 + small energy dependent term)
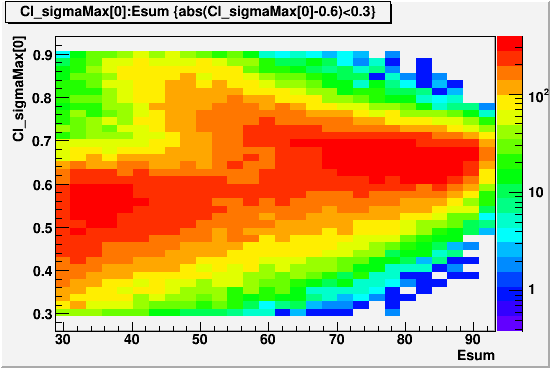
Here is the distribution of SigmaMax vs Summed Energy for the first cluster.
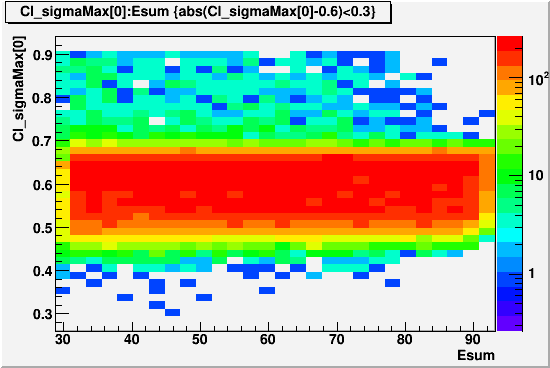
Because most clusters actually have SigmaMax greater than 0.5, they are almost never considered 1-photon-ish. Vast majority of times they satisfy the first if statement, where category can only be 0 or 2.
Once a cluster is determined to be 2-photon-ish, the following algorithm applies.
If SigmaMax*Ec > 35 then Category=2
else Category=0
So if the quantity SigmaMax*Ec is greater than 35, it is locked in to be a two photon cluster, and it will be fit accordingly. Looking at the distribution of this quantity,
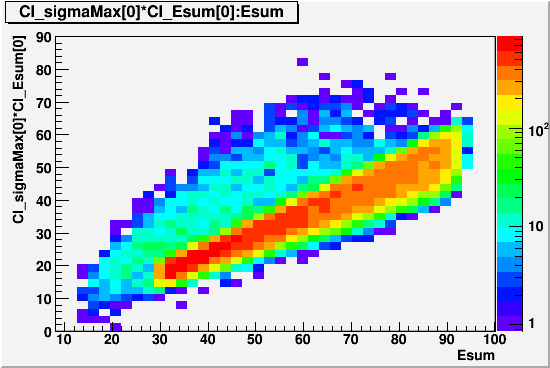
We see that just around 55~60GeV, it starts to go over 35. This is apparently what's causing the high probability of single photon splitting at Esum>55GeV.
So where did this parameterization of clusters come from? While it probably works well enough for two photon clusters, it rarely recognizes a single photon cluster correctly.
I can only guess at this stage, but the following plot is instruictive.
SigmaMax of the first cluster vs. Summed Energy for uniform spread Pi0 GSTAR simulation (Link to the Pi0 page)
The blob on the left corresponds to single photon clusters, and the blob on the upper right corresponds to two photon clusters. Presumably the goal of the parameterization we have was to distinguish the two based on SigmaMax. But there are two issues.
One is that at E>60GeV, a good portion of the two photon clusters would be indistinguishable from single photon clusters with SigmaMax~0.65. However, E>60GeV is likely beyond the energy scale that this parameterization was intended for.
The other is that even at lower energy, the formula that we have seems to expect SigmaMax to be much lower than what we see in these plots. To be more precise, at 30GeV, to be considered for Category 1, SigmaMax needs to be smaller than 0.54. This seems very difficult if we were to trust GSTAR. On the other hand, we know that data tend to yield smaller, sharper clusters, so perhaps this was tuned against data.
If we plot the category functions in the SigmaMax vs. Esum space, we get the following.
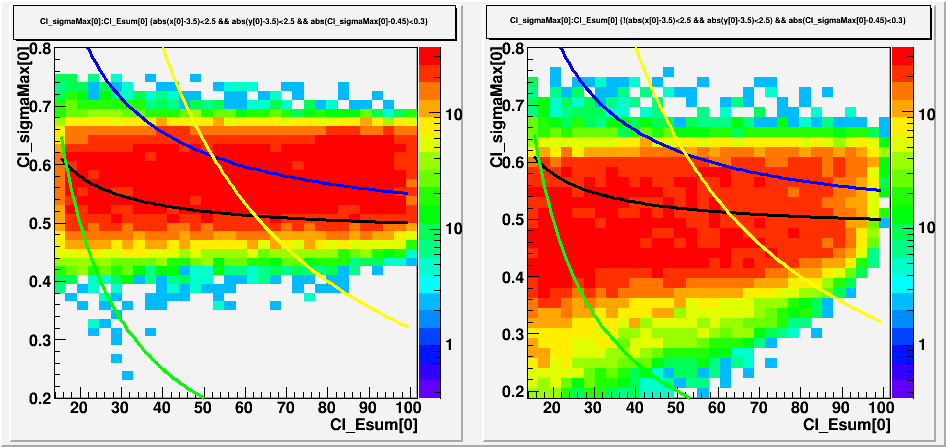 The
The
The left pannel is for inner events, and the right pannel is for the edge. Everything above both yellow and blue line is category 2. Everything under black and green is category 1. The rest is category 0.
Likely, these functions were tuned against pi0 simulation, as shown below in the case of inner pi0 events.
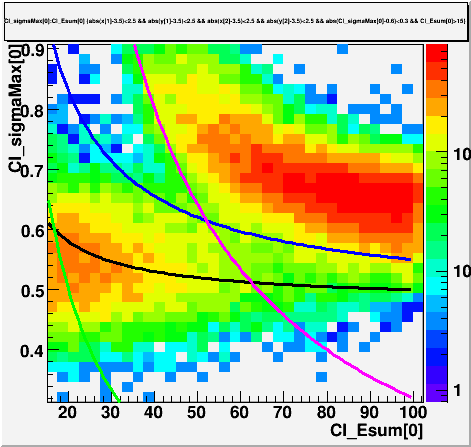
As can be seen, the function scoops up the two photon pi0 clusters nicely and puts them into category 2.
Groups:
- leun's blog
- Login or register to post comments