- leun's home page
- Posts
- 2013
- 2012
- December (2)
- October (3)
- September (2)
- August (1)
- July (4)
- June (4)
- May (2)
- April (3)
- March (5)
- February (5)
- January (5)
- 2011
- December (3)
- November (3)
- September (5)
- August (2)
- July (2)
- June (3)
- May (4)
- April (4)
- March (2)
- February (4)
- January (2)
- 2010
- December (2)
- November (3)
- October (3)
- September (5)
- August (6)
- July (2)
- June (4)
- May (3)
- April (4)
- March (4)
- February (2)
- January (4)
- 2009
- 2008
- October (1)
- My blog
- Post new blog entry
- All blogs
Run6 FPD Single Photon GSTAR
Using the geometry configuration y2006g, which apparently has the east FPD at "far" position (x>~50cm), we look at the response of Yiqun reconstruction to single photons.
So far we have only put flat distribution in E and pT using the user/phasespacce function in GEANT. More realistic distributions will come later.
There also seems to be some issue with the geometry, as I'm likely seeing ~0.2 cell size error in y-coordinate between the FPD location in the analysis code I'm using, and the apparent FPD location in GEANT. This is certainly something I'm doing wrong, but for the purpose of this page this error is probably not crucial. NOTE: The offset is due to the slight mismatch between the GSTAR geometry and the geometry file used for the recconstruction. At this point I'm not sure why the discrepancy exists.
60,000 single photons, 1000 per 1 GeV interval from 30GeV to 90GeV, are sprayed at the central 5x5 matrix of the east FPD at far position.(no vertex smearing) I did not add any digitization effects or noise. The hit contents are put strait into a 7x7 matrix and fed into the Yiqun reconstruction.
Probability of a single photon splitting into two as a function of summed energy in the FPD
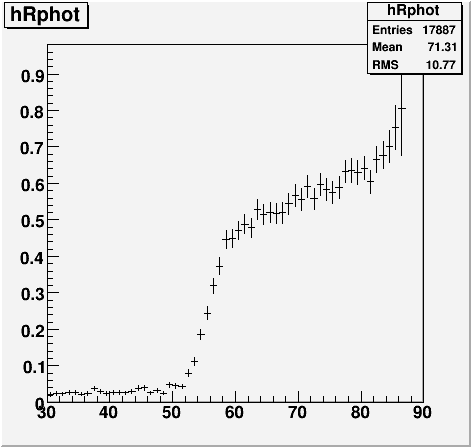
Clearly, at around 55GeV, single photon splitting becomes significant. For the following analysis, we focus on Esum>55GeV unless otherwise noted.
Invariant mass distribution for these false two photon events, Esum>55GeV
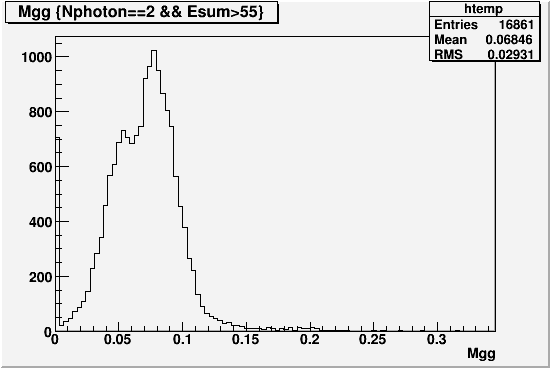
Apparently, there are two discernable peaks, both well below the pi0 mass. The energy dependence of this mass disribution is very mild.
The two peaks correspond to the two rather distinct modes in which the reconstruction finds two photon in a single photon cluster. The division between these two modes are very obvious both in Dgg(separation between the two fake photons) and Zgg(energy sharing between the two fake photons) distributions.
Mass vs. Separation
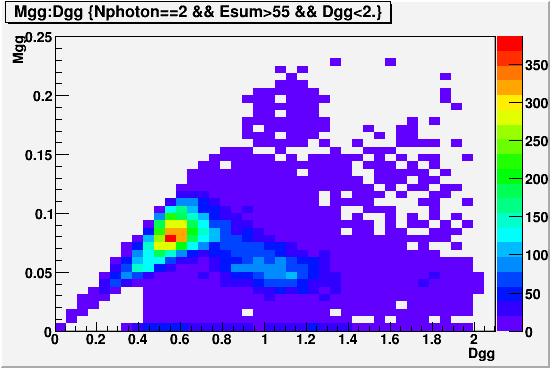
Here we see that there is one mass peak at around half a cell separation, and then another one at around one cell separation. Interestingly, the separation shows a strong correlation with the energy sharing.
Zgg vs. Separation
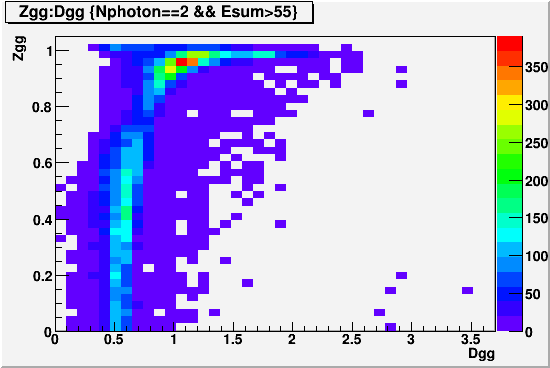
Zgg is fairly flat up to 0.7 for Dgg<0.8. High Z tends to come from larger separations pairs. This suggests that the usual Zgg cut at 0.7 is very effective in cutting off one of the two peaks. If we re-plot the invariant mass distribution in two parts with Z>0.7 and Z<0.7,
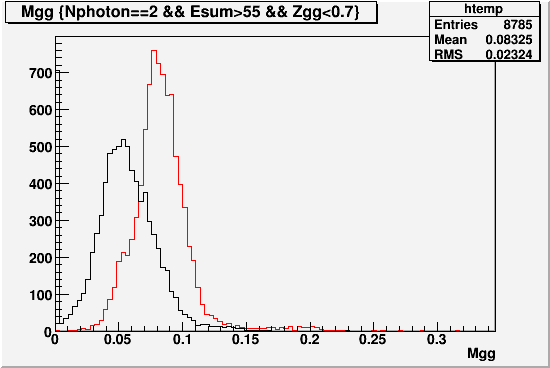
With the Zgg cut of less than 0.7, we will only have the red peak left. The resulting invariant mass distribution as a function of FPD Esum looks like this.
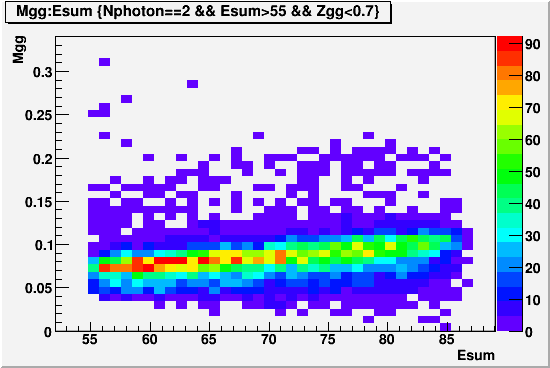
So what are these two modes?
First, we look at the GENERATED x,y coordinates of the original single photon for the case where we get two photons with Zgg<0.7 (The red peak)
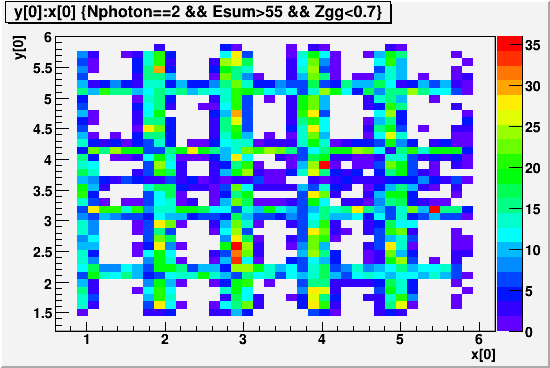
We are clearly selecting for those photons that hit the cell boundaries. Furthermore, horizontal incident angle due to the >50cm x-offset at the far position seems to be a factor.
The following plot shows the relative angle between the two photons in X-Y plane for Zgg<0.7. Zero is when two photons are horizontally aligend and the higher energy photon is further away from the beam. +pi/2 is when two photons are vertically aligned and the higher energy photon is higher up from the lower energy photon.
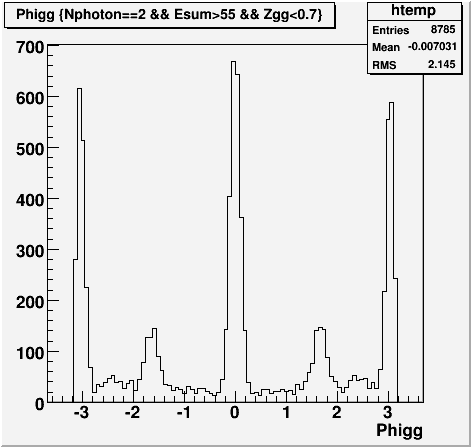
While the cell boundary effect likely prefers horizontal and vertical alignments, there is a strong enhancement in the horizontal direction. These events have clusters with two high towers horizontally aligned, which means the photon hit the vertical cell boundary. From these clusters, the reconstruction tends to conjure up two photons with half a cell separation.
For the other peak with Zgg>0.7, we see a more asymmetric distribution.

The horizontal enhancement is still there, but now the reconstruction is much more likely to find the higher energy photon to be closer to the beam. Looking at the event by event eneregy distributions, these events correspond to the clusters that seem to develop long tail away from the beam. This is probably due to the incident angle effect. The reconstruction tens to find a very soft photon at about or greater than a cell size away from the real photon, thereby creating a very high Z photon pair.
- leun's blog
- Login or register to post comments
