- leun's home page
- Posts
- 2013
- 2012
- December (2)
- October (3)
- September (2)
- August (1)
- July (4)
- June (4)
- May (2)
- April (3)
- March (5)
- February (5)
- January (5)
- 2011
- December (3)
- November (3)
- September (5)
- August (2)
- July (2)
- June (3)
- May (4)
- April (4)
- March (2)
- February (4)
- January (2)
- 2010
- December (2)
- November (3)
- October (3)
- September (5)
- August (6)
- July (2)
- June (4)
- May (3)
- April (4)
- March (4)
- February (2)
- January (4)
- 2009
- 2008
- October (1)
- My blog
- Post new blog entry
- All blogs
Run6 FPD Shower Shape
Run6 FPD Shower Shape Simulation and Data Comparison
The shape of the shower depends heavily on the topology of the event. A shower produced by a photon that hit the corner where 4 cells meet is obviously very different from a shower produced by a photon that hit a cell right in the center. To some extent, the difficulty in comparing data and simulation shower shapes came from the lack of realistic energy spectrum in the simulation, and therefore different mixtures of these different types of showers.
Naturally, the way to go is to classify the events based on their topology, remove the edge effect by only considering central clusters, and make the comparison between simulation and data only within each category.
In both simulation and data, there is a strong tendency for clusters to be found in the center of a cell. That is, photons that hit in the vicinity of the cell center generate very similar showers due to the physical size of the cell. (3.81cm X 3.81cm) On the other hand, photons that hit 2 cell boundaries or 4 cell corners provide wealth of information, and very high position accuracy.
All simulation results are from flat distribution single photon GSTAR with noise and digitization effects.
Fig.1 Y vs. X position of single photon clusters from Simulation
.gif)
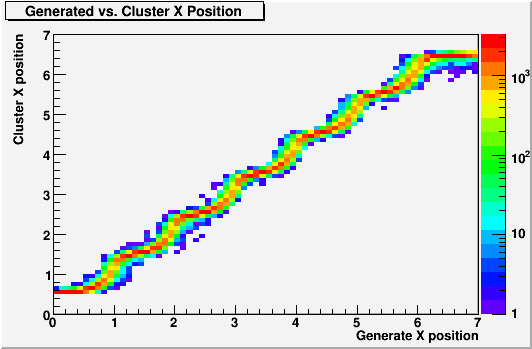
Fig. 2. Generated vs. Cluster X position from single photon simulation

We wish to categorize the event topology based on the cluster position, which is a very low level quantity that is independent of fitting. Taking the non-linear relationship between the actual position of the photon and the cluster position, the following categories are used. All numbers are in the units of cell width.
1. Central events, where a photon hit the center of the cell: Cluster position in the central 0.14X0.14 square of a cell
2. Corner events, where a photon hit the corner of 4 cells: Cluster position in the 0.4X0.4 square centered at the corner
3. Edge events, where a photon hit the center of the boundary between 2 cells: Cluster position in the 0.4X0.14 rectangle centers at the center of a 2 cell boundary
For all following analysis, the position of the cluster is required to be within the central 4X4 of the FPD. This is roughly consistent with the previous "inner" categorization for photon position, which was central 5X5, as the range of cluster position is 0.5~6.5 in cell units.
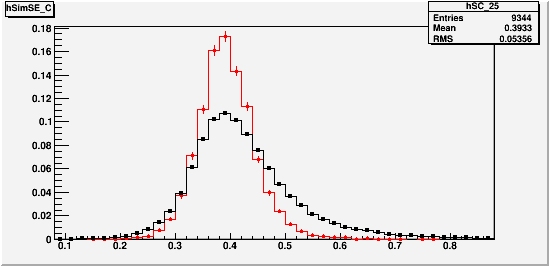
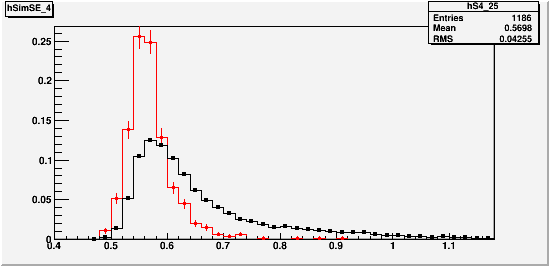
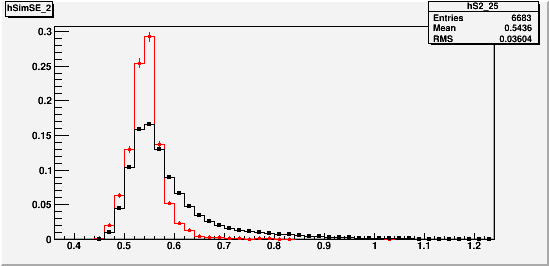
For the three cases, we look at the fraction of the cluster energy that the top three highest energy towers carry. Red points are from the single photon simulation, and black points are from the East South FPD, run6 transverse data.
Data "single photon" clusters were chosen by selecting clusters that produced one(and only one) of the two photons that form a pi0 with Egg<50GeV, Mgg=0.135+-0.04, and Dgg>2.
Fig. 3 For central events, the energy fraction for (from the left) the highest tower, the second highest tower, and the third highest tower within the cluster. RED:Simulation, BLACK:Data

Fig. 4 For 4-corner events, the energy fraction for (from the left) the highest tower, the second highest tower, and the third highest tower within the cluster. RED:Simulation, BLACK:Data

Fig. 5 For 2 cell boundary events, the energy fraction for (from the left) the highest tower, the second highest tower, and the third highest tower within the cluster. RED:Simulation, BLACK:Data

We also compare the Cluster Sigma Max distribution betweeen data and simulation. This is a crucial variable that essentially determines the categorization of the clusters into 1 or 2 photon clusters.
Fig. 6. Cluster Sigma Max for Central events, Red:Simulation, Black: Data

Fig. 7. Cluster Sigma Max for Corner Events, Red:Simulation, Black: Data

Fig. 8. Cluster Sigma Max for Edge events, Red:Simulation, Black: Data

Overall, the shower shapes in data and simulation seem to be in a qualitative agreement. The means of the distributions are actually in good agreement quantitatively, but the data displays consistently loger tails in almost all cases. While this is not crazy considering the relative simplicity of the simulation, it would be important to understand these differences if we were to use the results of reconstruction study in the simulation quantitatively to attack the background and cross section in data. One possible source of the discrepancy is the fact that the gain corrections are perfect and uniform in the simulation, which is studied further in this webpage. (with some digression)
- leun's blog
- Login or register to post comments
