Run 9 Dijet Unfolding
Starting to look at the effect of unfolding. For now, I'm only considering the smearing effect. The end goal is to find how reliable our unfolding is in light of data-simulation mismatch. (Is the effect dependent on the topology of the detector?) The unfolding plots below may hint as to how the mismatch affects cross-section calculations.
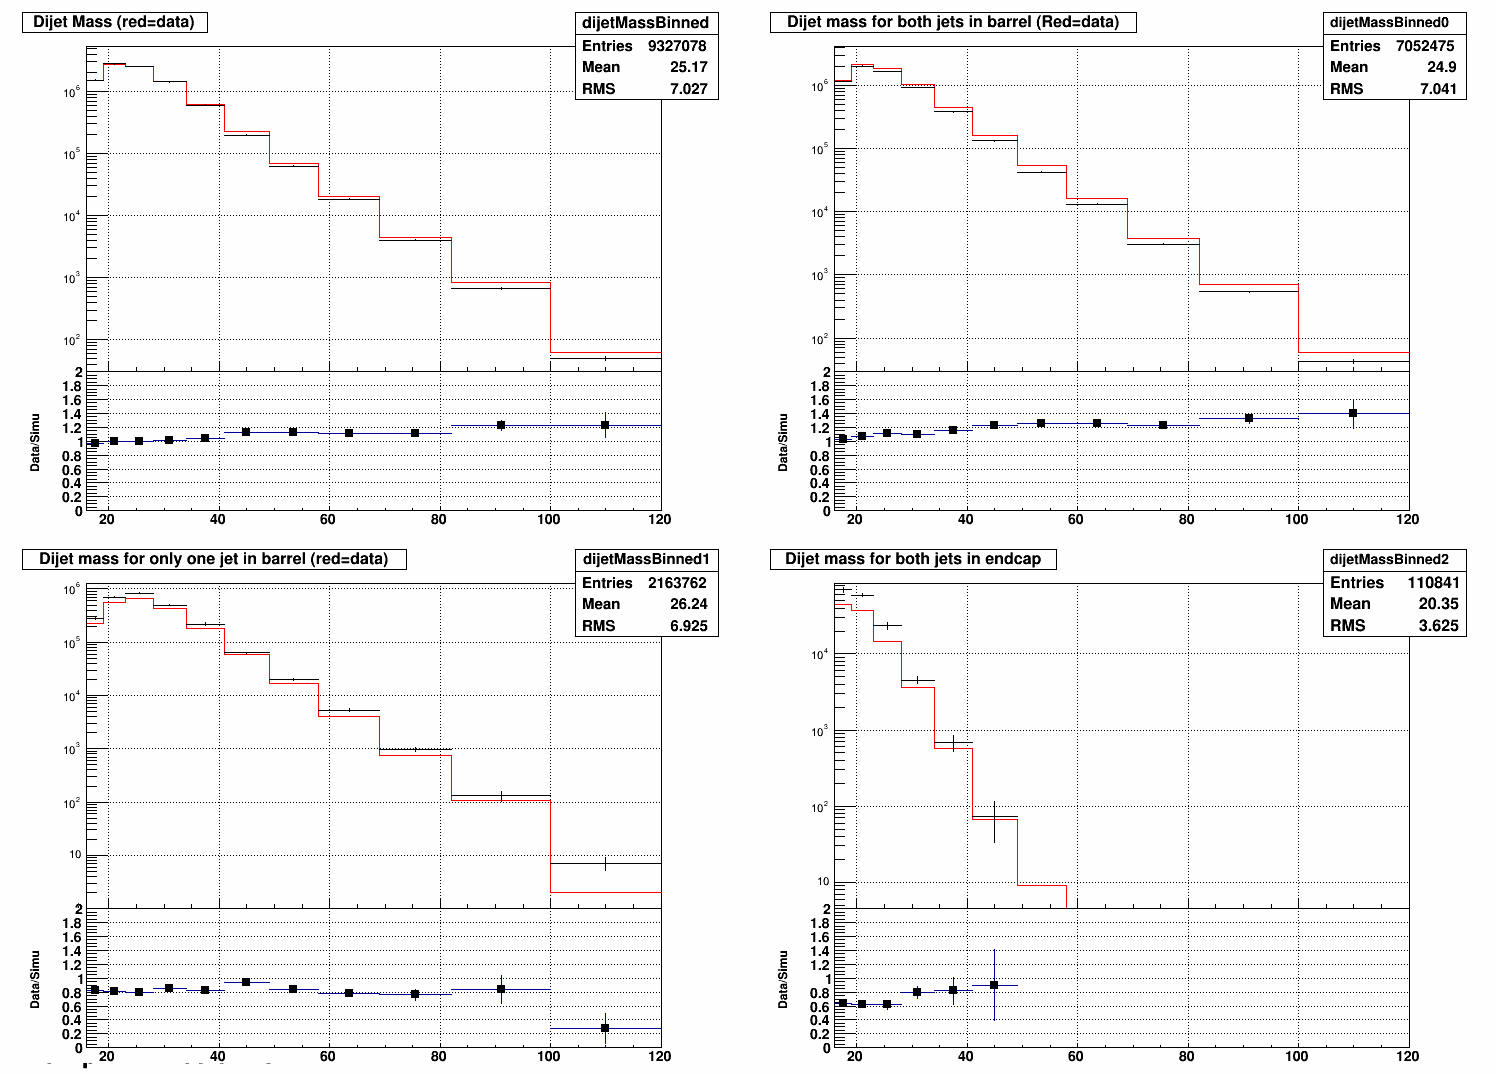
First plots compare the data and detector-level simulation, broken into all dijets, barrel-barrel dijets, barrel-endcap, and endcap-endcap.
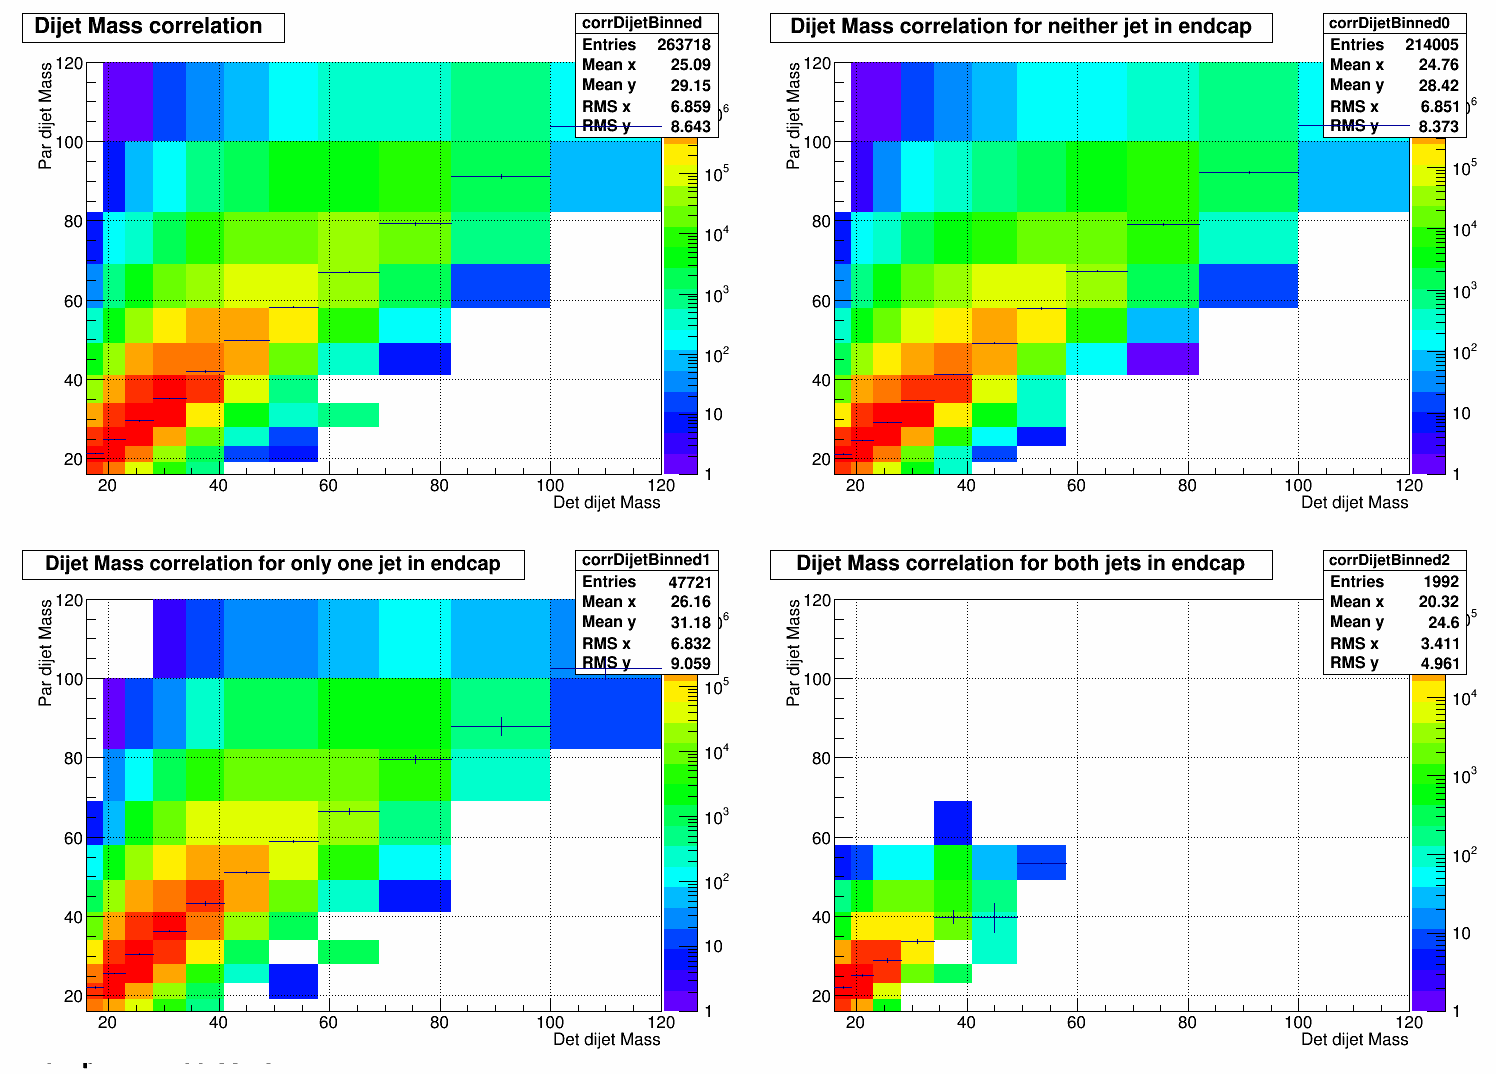
The next set of plots show the 2D response matrix, particle-level vs detector-level simulation, again broken into all dijets, barrel-barrel, barrel-endcap, and endcap-endcap.
All of the profile plots on the previous four plots are combined to compare:

The response matrices were then used in the unfolding of the data (using the SVD method in RooUnfold). The data is plotted in red along with the unfolding.
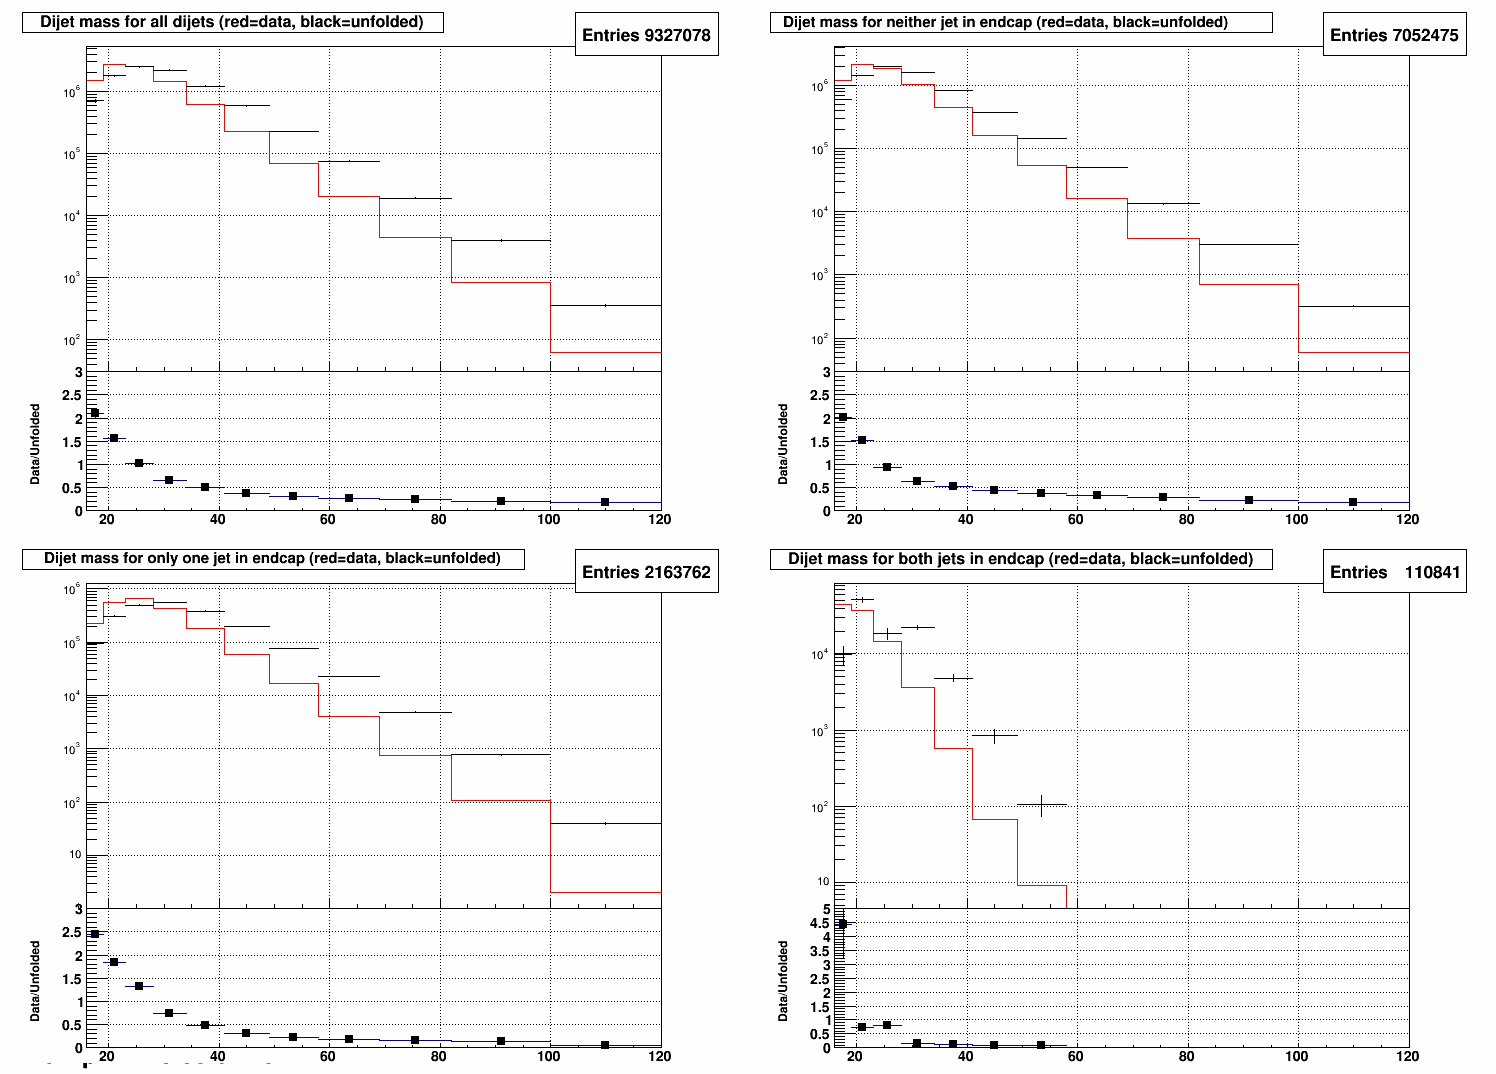
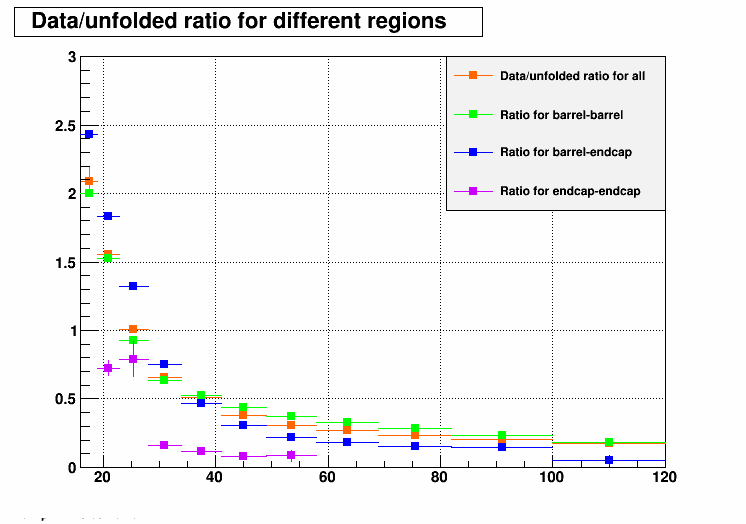
The endcap-endcap unfolding looks somewhat bumpy, probably due in part to low statistics. All of the ratio plots are combined to look at possible trends.
- ezarndt's blog
- Login or register to post comments