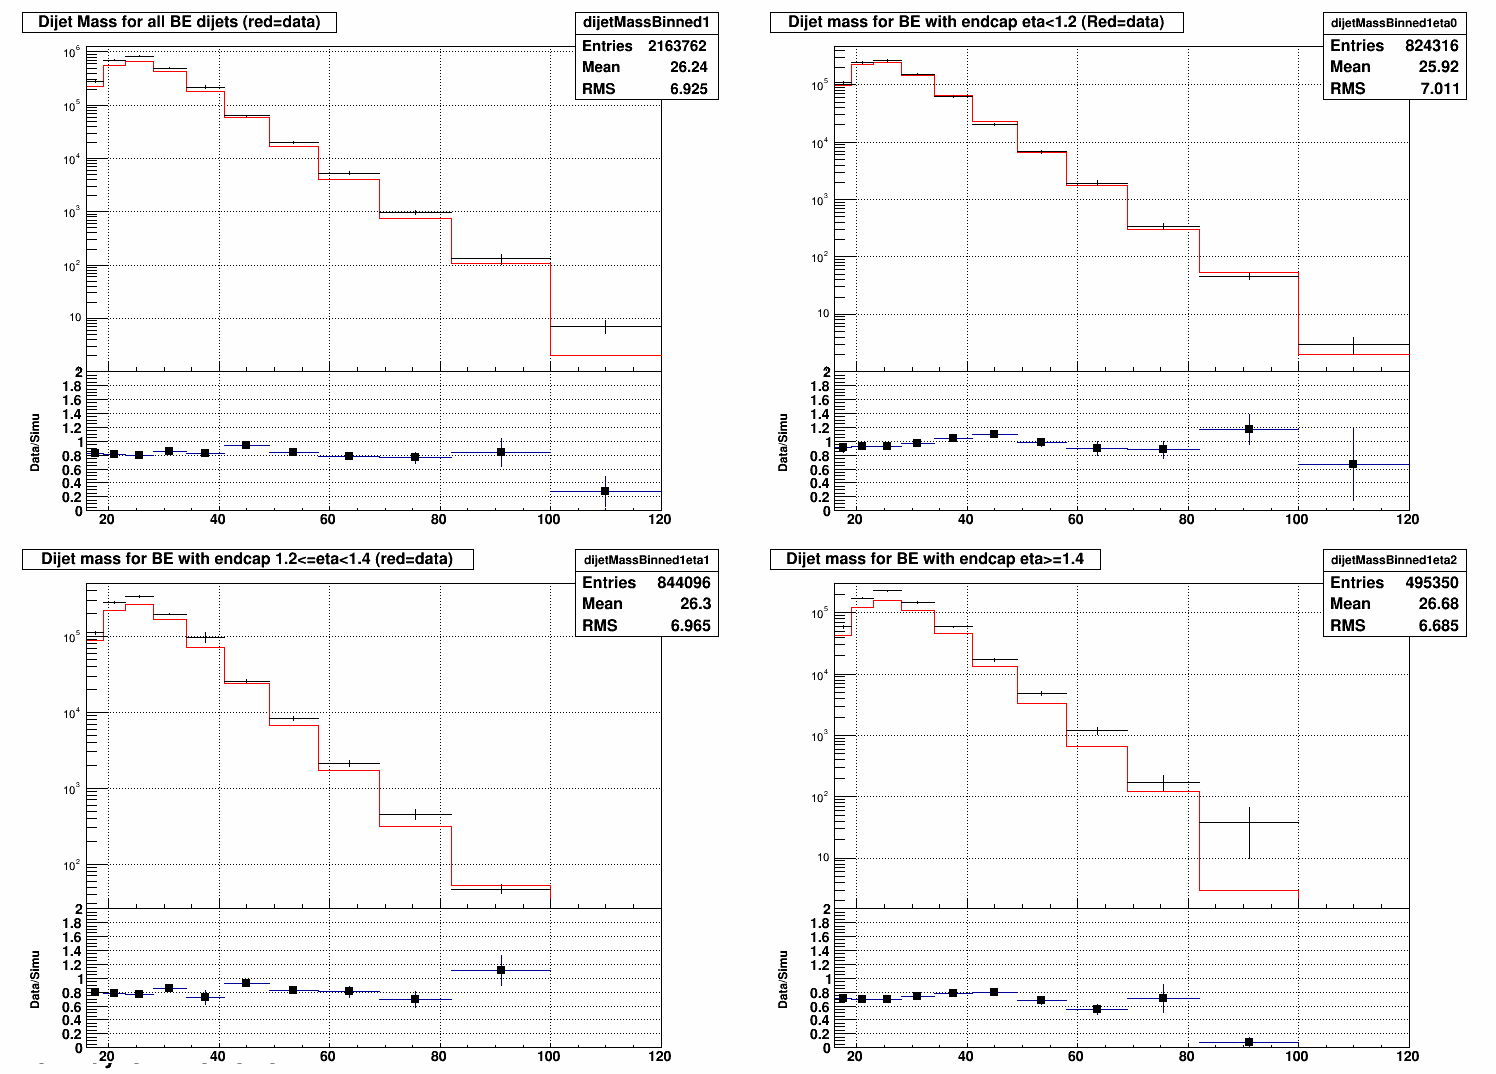
Run 9 Dijet Mass in the Endcap
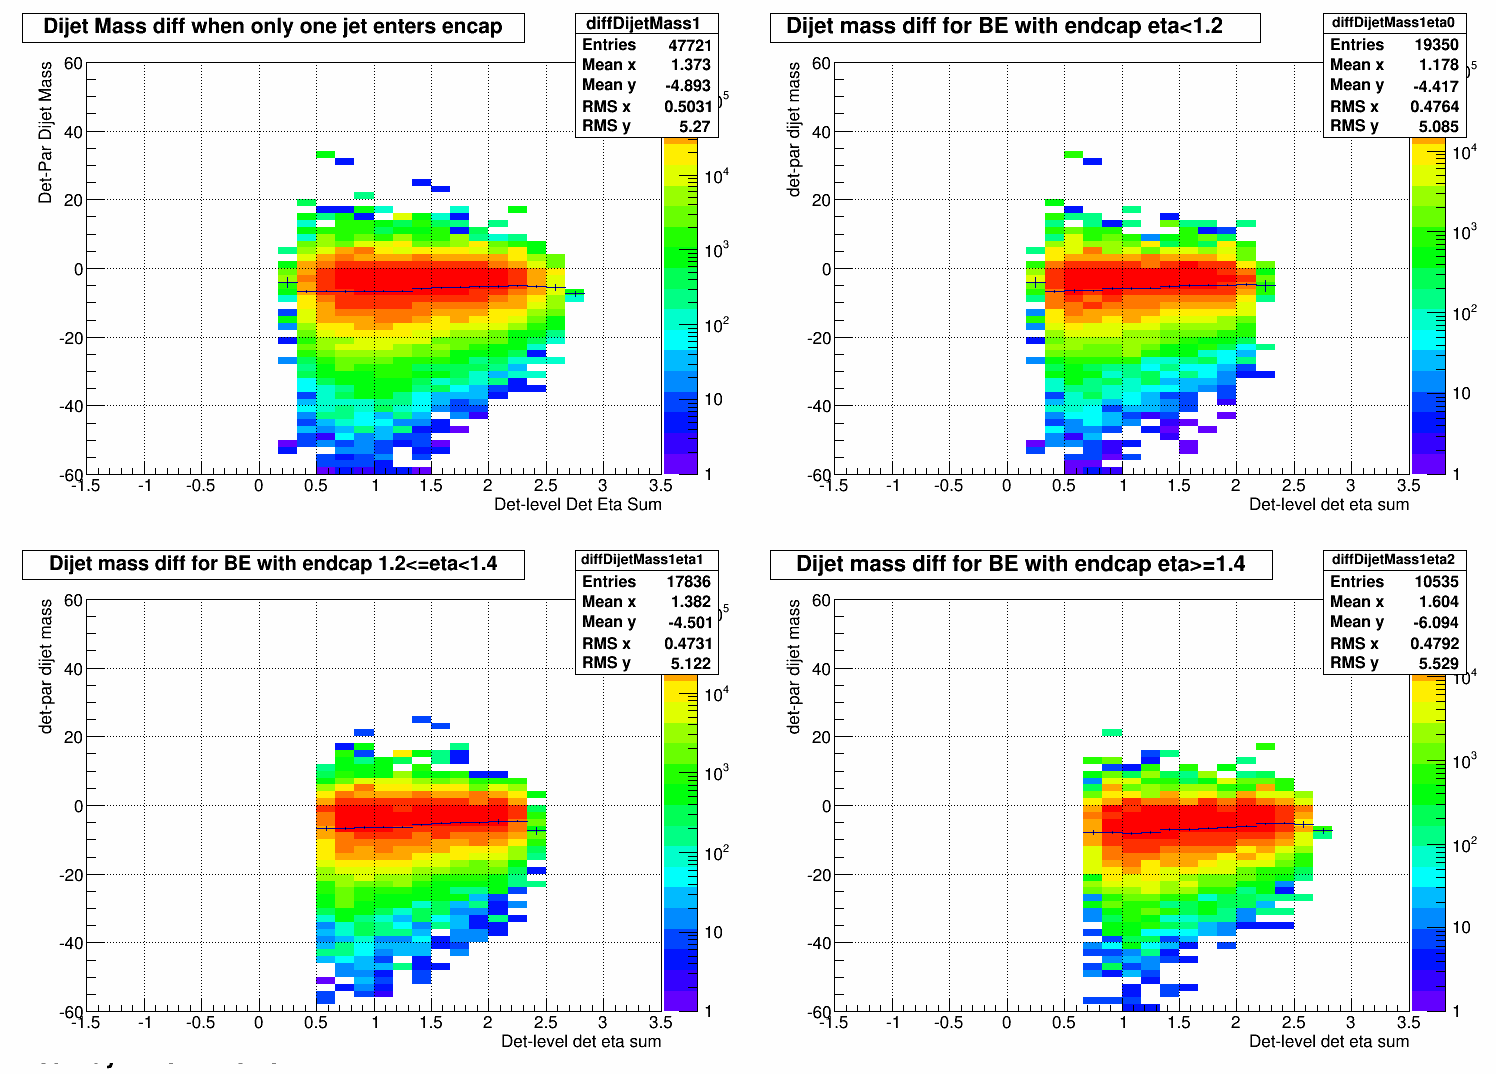
In lieu of 2D unfolding (for now), I've broken the dijet mass plots into eta chunks within the endcap. The plots below are looking at barrel-endcap dijets, with the endcap jet falling within the specified eta range.
The first figure shows the difference between detector-level dijet mass and particle-level dijet mass.
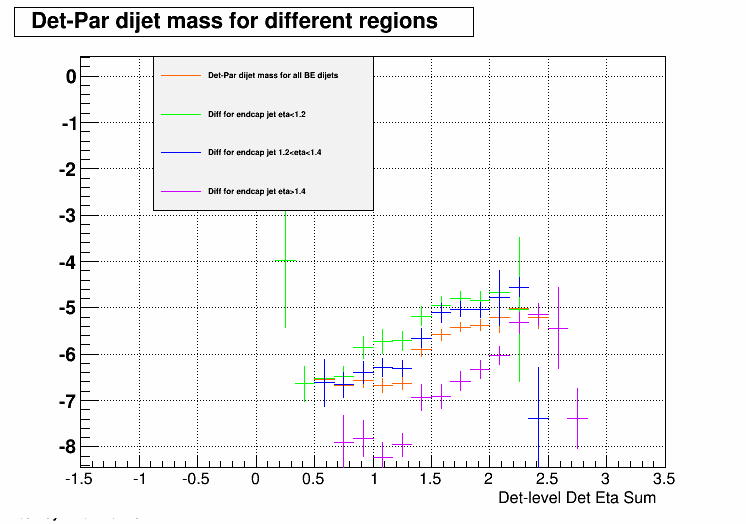
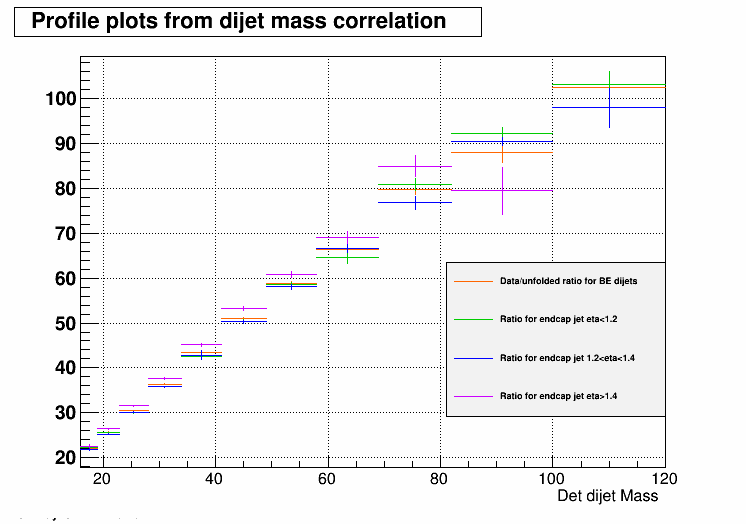
This next figure shows all of the profile plots above from the different regions plotted together.
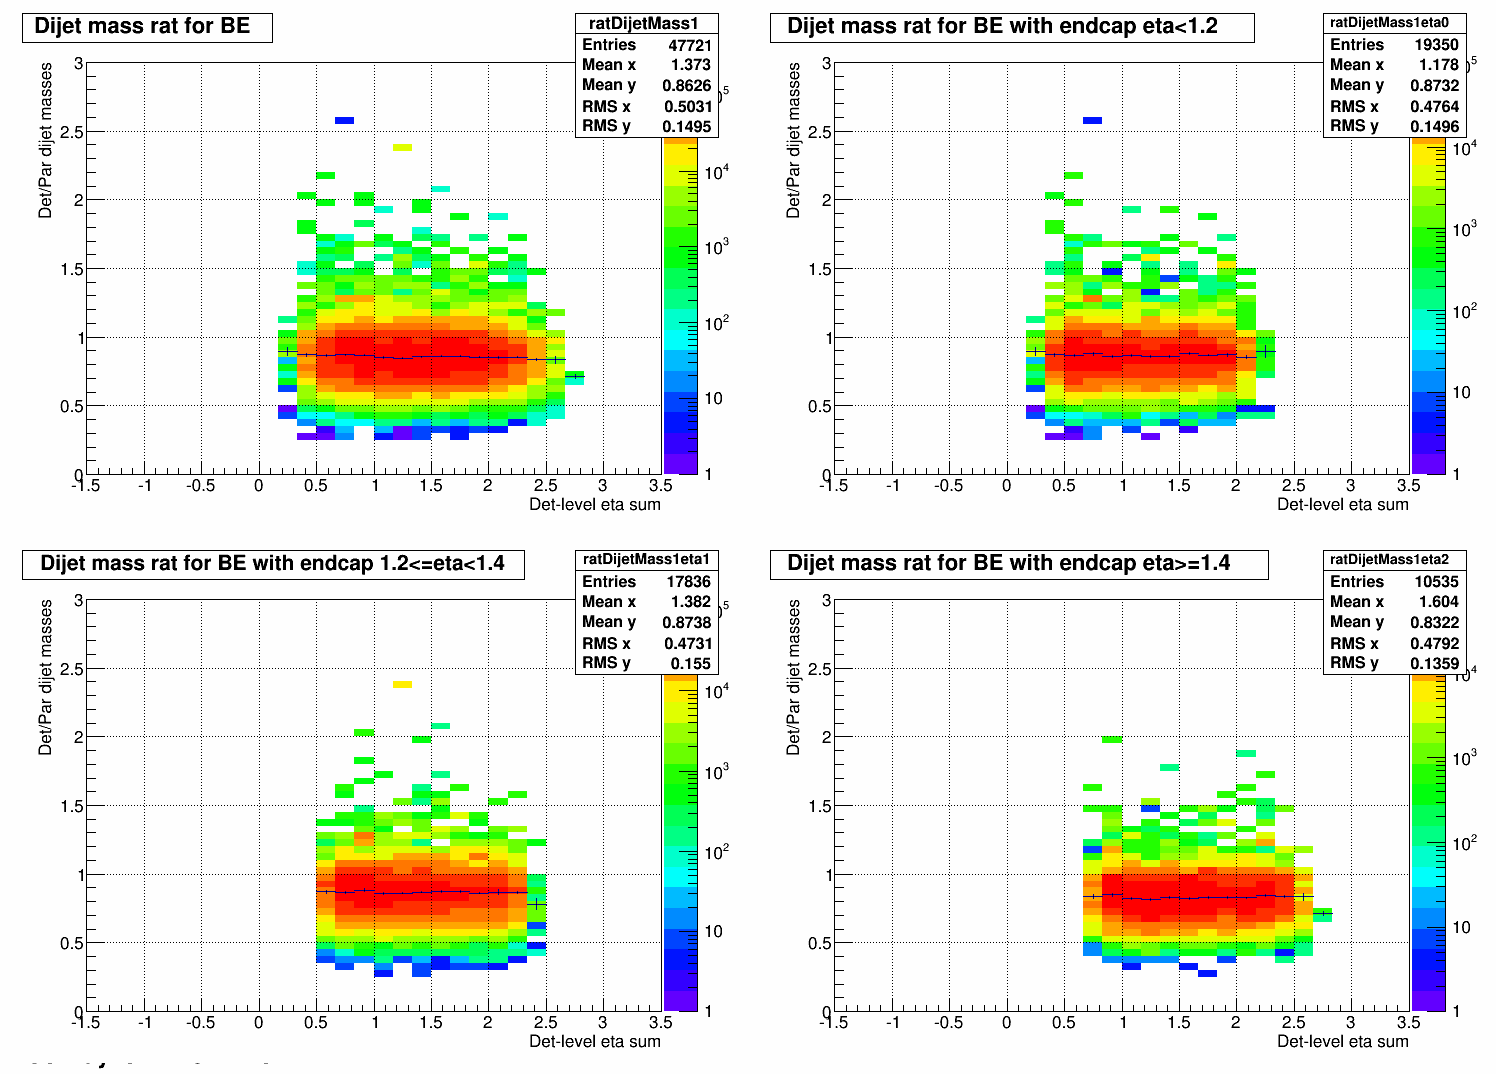
Plotting instead the ratio of detector-level dijet mass divided by particle-level dijet mass...
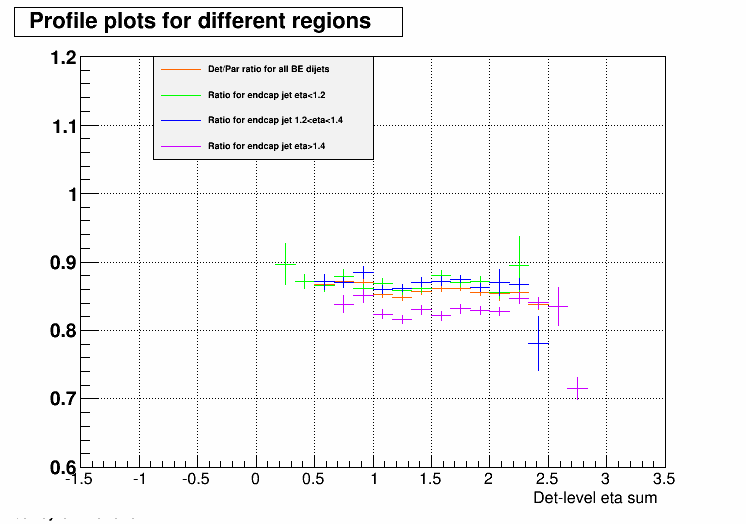
The two first rapidity bins (blue and green) look like they have similar profile plots for the most part. In the largest rapidity range (purple), the detector-level consistently differs from the particle-level to a greater extent than the other rapidity bins.
Plots of the dijet mass from data in red and detector-level simulation in black:
The response matrix for each of the regions:

The detector- and particle-level dijet mass are weirdly correlated at higher dijet mass, probably hinting that we suffer from low statistics.
The data (red) and the unfolding (black) are plotted here. This only takes into account smearing effects, not the efficiency numbers from pythia.
.png)
.png)
The larger eta bin (purple) appears to behave differently from the others, but this may be an effect of low statistics.
Next step: 2D unfolding.
- ezarndt's blog
- Login or register to post comments